About MCaaS
JMeter
Load and performance testing is highly recommended so that tenants can tune deployment configurations to scale to true load.
MCaaS offers JMeter for performance testing. JMeter is integrated into MCaaS Jenkins Templating Engine Pipeline Libraries. It can easily be added into existing application build pipelines, or run in a standalone Jenkins job. Results are viewable and downloadable through Jenkins.
Usage
Leveraging MCaaS's JMeter integration requires creating a JMeter test plan. JMeter's Getting Started documentation details how to do this.
Once a test plan has been created, it needs to be saved in the repo associated with the Jenkins job.
JMeter can be added into an existing MCaaS Jenkins pipeline by adding jmeter as a library in a tenant's pipeline_config.groovy file, and then calling the jmeter method within a pipeline's Jenkinsfile.
Here is a simplified example of adding jmeter to a pipeline_config.groovy file. This loads the jmeter library into a pipeline:
libraries {
  jmeter
}
Here is an example jmeter call within a pipeline's Jenkinsfile. This executes the jmeter method:
jmeter([
  jmeter: [
    jmeter_test_plan_path: <test plan filename relative to the root of this job's repository>
  ]
])
Results
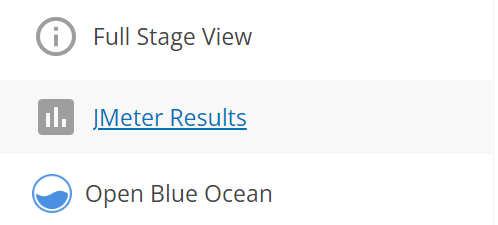
Jenkins will save JMeter test results into a "JMeter Results" tab. This is available via the left-side navigation panel in the Jenkins job console:

Or listed as a folder under the "Artifacts" tab in Jenkin's Blue Ocean UI:

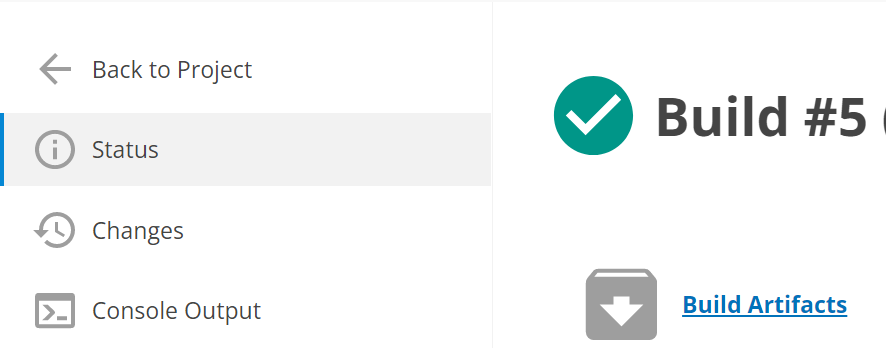
Results can be downloaded from the Blue Ocean Artifacts tab shown above, or the Build Artifacts link in the regular UI's job status page:

Todo
-
Run JMeter within tenant VPCs
MCaaS's JMeter integration currently runs in the MCaaS CI VPC. As such, JMeter will route through VPN tunnels and the FCS Netservices VPC to reach tenant applications running in their MCaaS tenant VPC. MCaaS will build out the option to choose to run JMeter within a tenant VPC, bypassing the extra network hops.
-
Support Datadog's JMeter Integration, so tenants can view JMeter results from within their Datadog dashboards.

