About MCaaS
Overview
Navigation Overview
When you log into Datadog, you are greeted with the following homepage. By default, the APM view is shown. This view shows service activity for the past hour
The left navigation pane will allow you to switch between the views
<table> <col width="50%" /> <col width="50%" /> <tbody> <tr class="odd"> <td align="left"><p><strong>View</strong></p></td> <td align="left"><p><strong>Description</strong></p></td> </tr> <tr class="even"> <td align="left"><p>Watchdog</p></td> <td align="left"><p>Automatically send trends in your applications and infrastructure metrics</p></td> </tr> <tr class="odd"> <td align="left"><p>Events</p></td> <td align="left"><p>Records of activity noteworthy for engineers</p></td> </tr> <tr class="even"> <td align="left"><p>Dashboards</p></td> <td align="left"><p>Visualize your data to gain insight</p></td> </tr> <tr class="odd"> <td align="left"><p>Infrastructure</p></td> <td align="left"><p>Track your hosts, containers, processes and serverless functions</p></td> </tr> <tr class="even"> <td align="left"><p>Monitors</p></td> <td align="left"><p>Actively check metrics, integration availability, network endpoints and more</p></td> </tr> <tr class="odd"> <td align="left"><p>Metrics</p></td> <td align="left"><p>Explore your metrics and create distributions</p></td> </tr> <tr class="even"> <td align="left"><p>Integrations</p></td> <td align="left"><p>Gather data from your systems, apps and services</p></td> </tr> <tr class="odd"> <td align="left"><p>APM</p></td> <td align="left"><p>Gain insight on your application’s performance</p></td> </tr> <tr class="even"> <td align="left"><p>Notebooks</p></td> <td align="left"><p>Explore and share stories with your data</p></td> </tr> <tr class="odd"> <td align="left"><p>Logs</p></td> <td align="left"><p>Collect, process, explore, monitor and archive your logs</p></td> </tr> <tr class="even"> <td align="left"><p>Security</p></td> <td align="left"><p>Detect threats and misconfigurations across applications and infrastructure</p></td> </tr> <tr class="odd"> <td align="left"><p>UX Monitoring</p></td> <td align="left"><p>Automate user experience with synthetic browser tests</p></td> </tr> </tbody> </table>Infrastructure View
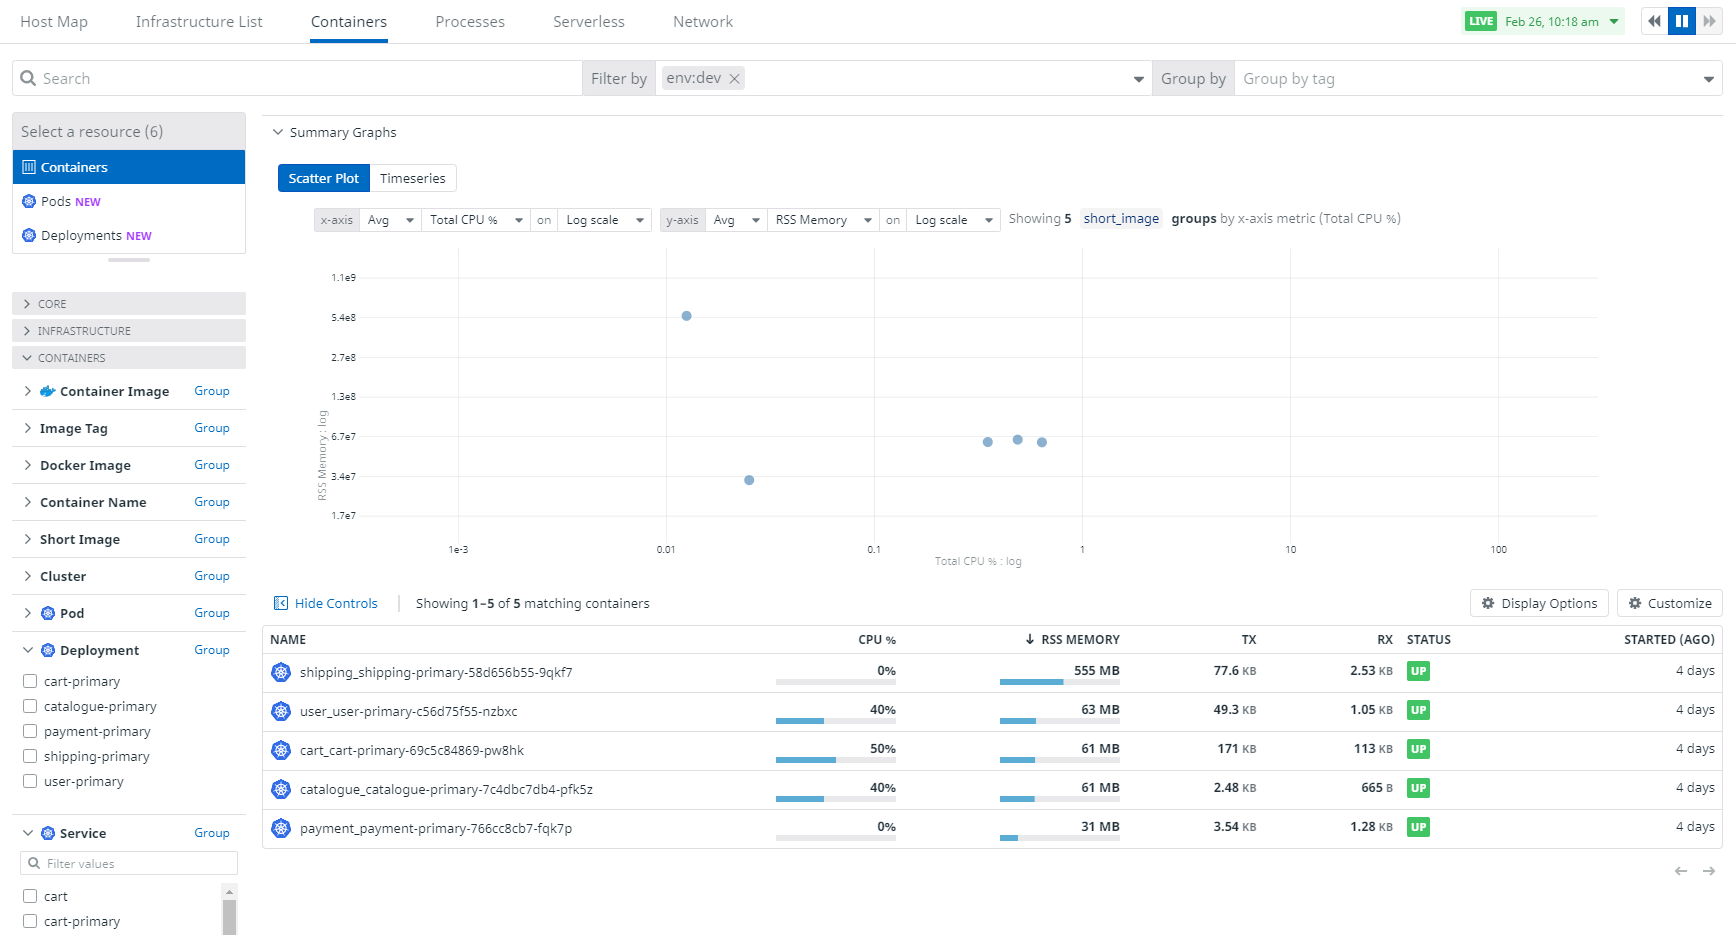
From the left navigation panel, click on Infrastructure → Containers

From the Containers view, change the resource in the upper left to Pods. This view will give you insight into the individual Pod health in your Kubernetes cluster.You can filter by status, namespace, deployment, service or environment
Clicking on a specific pod will expand its detailed view. The upper right contains a link to "View Pods Dashboard". The upper section shows the tags and labels associated with the pod. The middle section shows the pod health, CPU percentage and memory usage. The lower section provides details of the pod configuration, logs and events.
Here is a description of the different tabs
- YAML: Displays the full YAML specification for the pod. Provides information such as the image tag, environment variables, networking configuration, resource limits, health probe endpoints, and much more
Tip
The
containerStatusessection at the bottom is the first place to identify errors if the pod is unhealthy * Logs: Shows the logging associated with the pod. There are options to change the specific timeframe and link to the Log Explorer view. * Metrics: Displays a wide range of networking and performance metrics * Network: DIsplays TCP related metrics * Traces: Displays all distributed network calls. This needs to be enabled from the application. See Connect Logs and Traces * Events: Displays all actions performed on the pod Contains link to "Open in Event Stream"
Log View
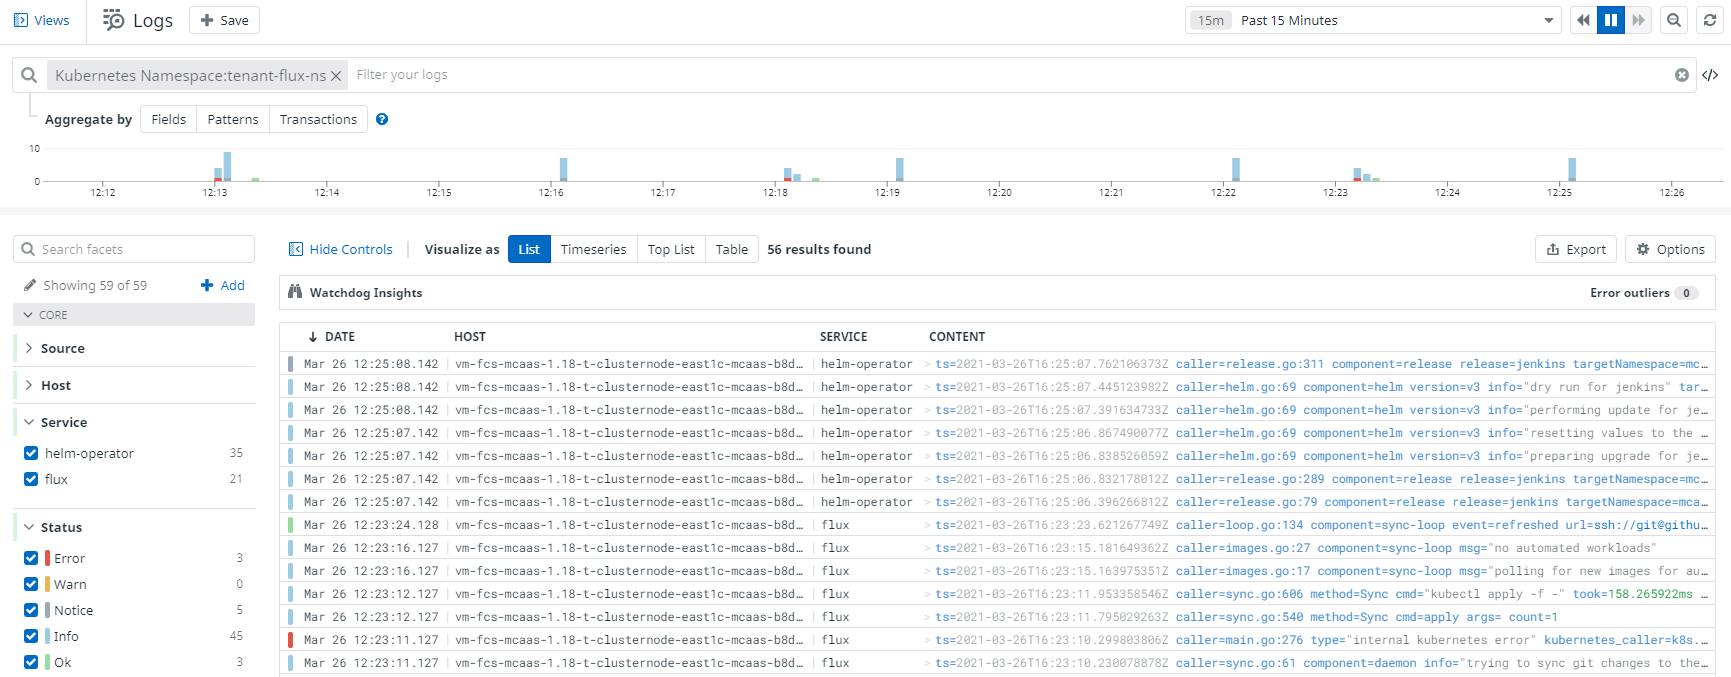
The log view is where you can see your application logs. In the upper right corner, you can change the time window displayed. Logs can be filtered by deployment, service, status, environment, namespace and message text.
The log view is also where you can identify deployment errors from Flux.
These messages will be logged under the tenant-flux-ns namespace.
Additionally, you will see the log messages for successful deployment
upgrades.

Traces View
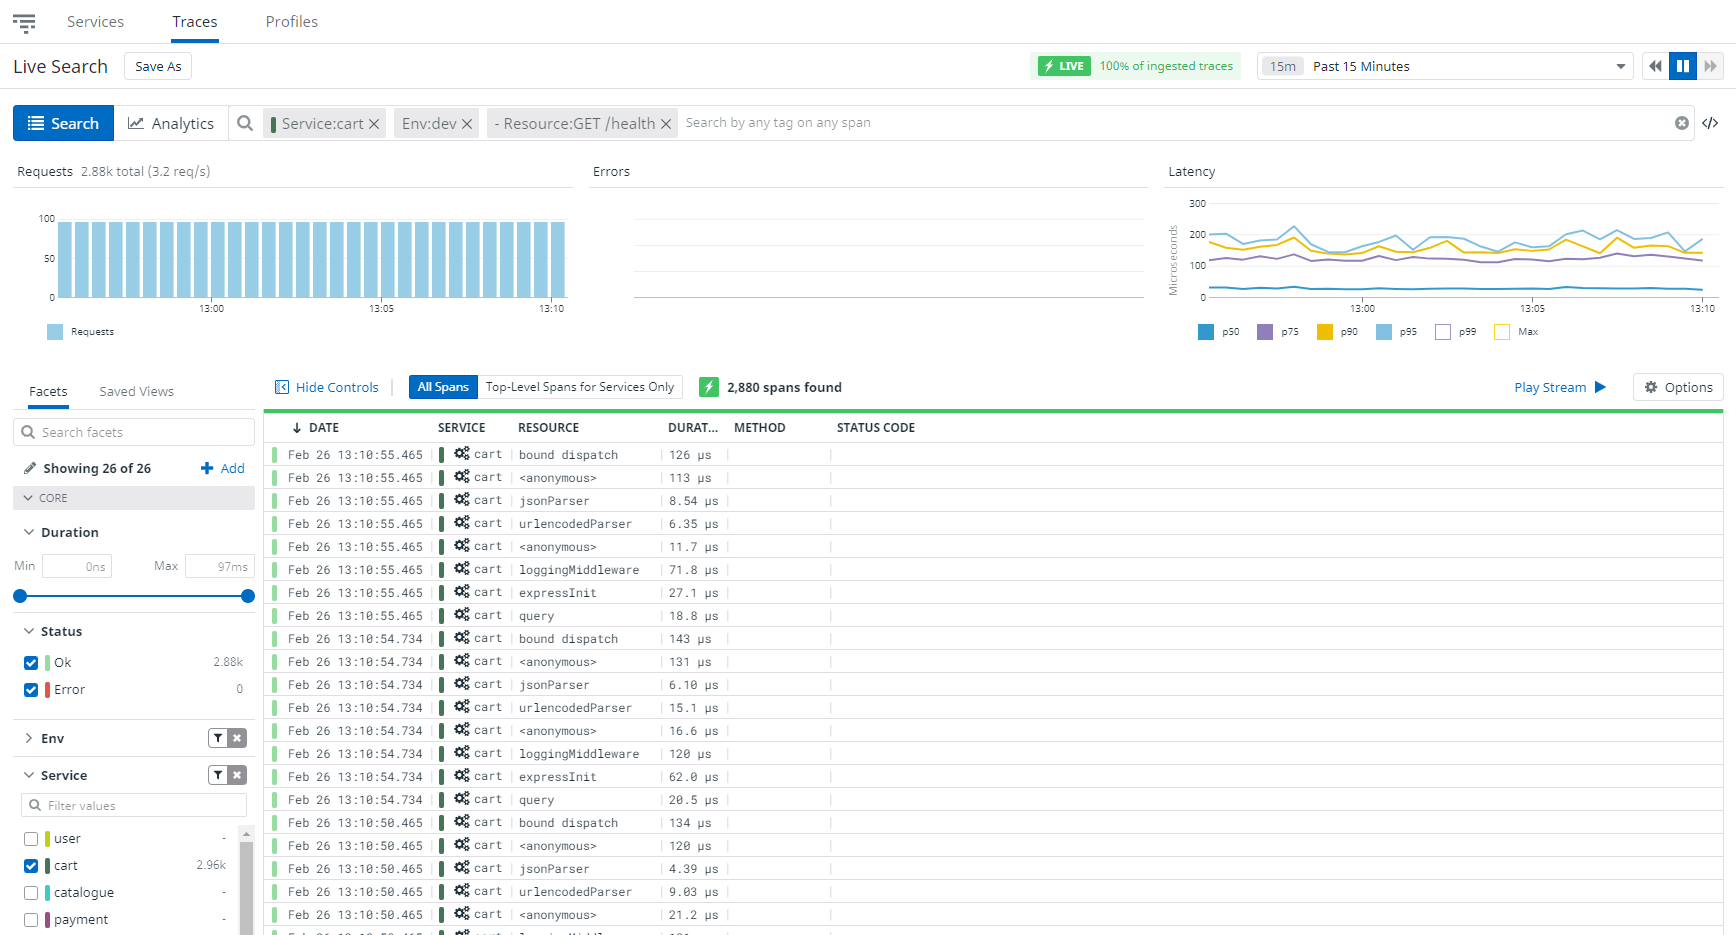
The traces view can be accessed from the APM → Traces menu option. This view is where you will find API endpoint invocations. Other than the healthcheck, these invocations are not captured by default and need to be instrumented in your application. See Connect Logs and Traces. This view can be filtered by service, resource, operation, environment and HTTP status.


