About MCaaS
Log Management
Follow the Datadog Agent installation instructions to start forwarding logs alongside your metrics and traces. The Agent can tail log files or listen for logs sent over UDP / TCP, and you can configure it to filter out logs, scrub sensitive data, or aggregate multi line logs. Finally choose your application language below in order to get dedicated logging best practices. If you are already using a log-shipper daemon, refer to the dedicated documentation for Rsyslog, Syslog-ng, NXlog, FluentD, and Logstash.
Datadog Log Management also comes with a set of out of the box solutions to collect your logs and send them to Datadog:
Datadog Integrations and Log Collection are tied together. Use an integration default configuration file to enable its dedicated processing, parsing, and facets in Datadog.
Find at the bottom of this page the list of available Datadog Log collection endpoints if you want to send your logs directly to Datadog.
Note
When sending logs in a JSON format to Datadog, there is a set of reserved attributes that have a specific meaning within Datadog. See the Reserved Attributes section to learn more.
Application Log collection
After you have enabled log collection, configure your application language to generate logs:






Container Log collection
The Datadog Agent can collect logs directly from container stdout/stderr without using a logging driver. When the Agent’s Docker check is enabled, container and orchestrator metadata are automatically added as tags to your logs. It is possible to collect logs from all your containers or only a subset filtered by container image, label, or name. Autodiscovery can also be used to configure log collection directly in the container labels. In Kubernetes environments you can also leverage the daemonset installation.
Choose your environment below to get dedicated log collection instructions:
Cloud Providers Log collection
Select your AWS Cloud provider below to see how to automatically collect your logs and forward them to Datadog:

Custom Log forwarder
Any custom process or logging library able to forward logs through TCP or HTTP can be used in conjunction with Datadog Logs.
HTTP
The public endpoint is http-intake.logs.datadoghq.com. The API key
must be added either in the path or as a header, for instance:
curl -X POST https://http-intake.logs.datadoghq.com/v1/input \
     -H "Content-Type: text/plain" \
     -H "DD-API-KEY: <API_KEY>" \
     -d 'hello world'
For more examples with JSON formats, multiple logs per request, or the use of query parameters, refer to the Datadog Log HTTP API documentation.
TCP
The secure TCP endpoint is intake.logs.datadoghq.com:10516 (or port
10514 for insecure connections).
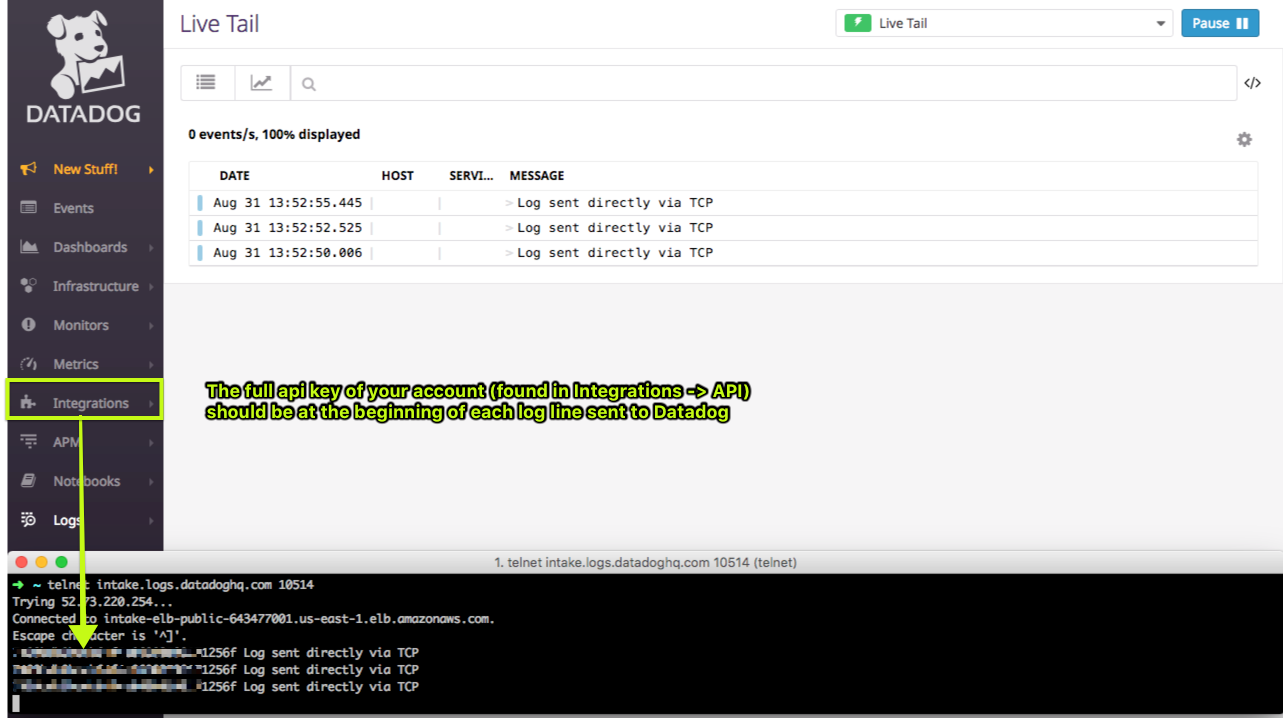
You must prefix the log entry with your Datadog API Key, e.g.:
<DATADOG_API_KEY> <PAYLOAD>
Note: <PAYLOAD> can be in raw, Syslog, or JSON format.
Test it manually with telnet. Example of <PAYLOAD> in raw format:
telnet intake.logs.datadoghq.com 10514
<DATADOG_API_KEY> Log sent directly via TCP
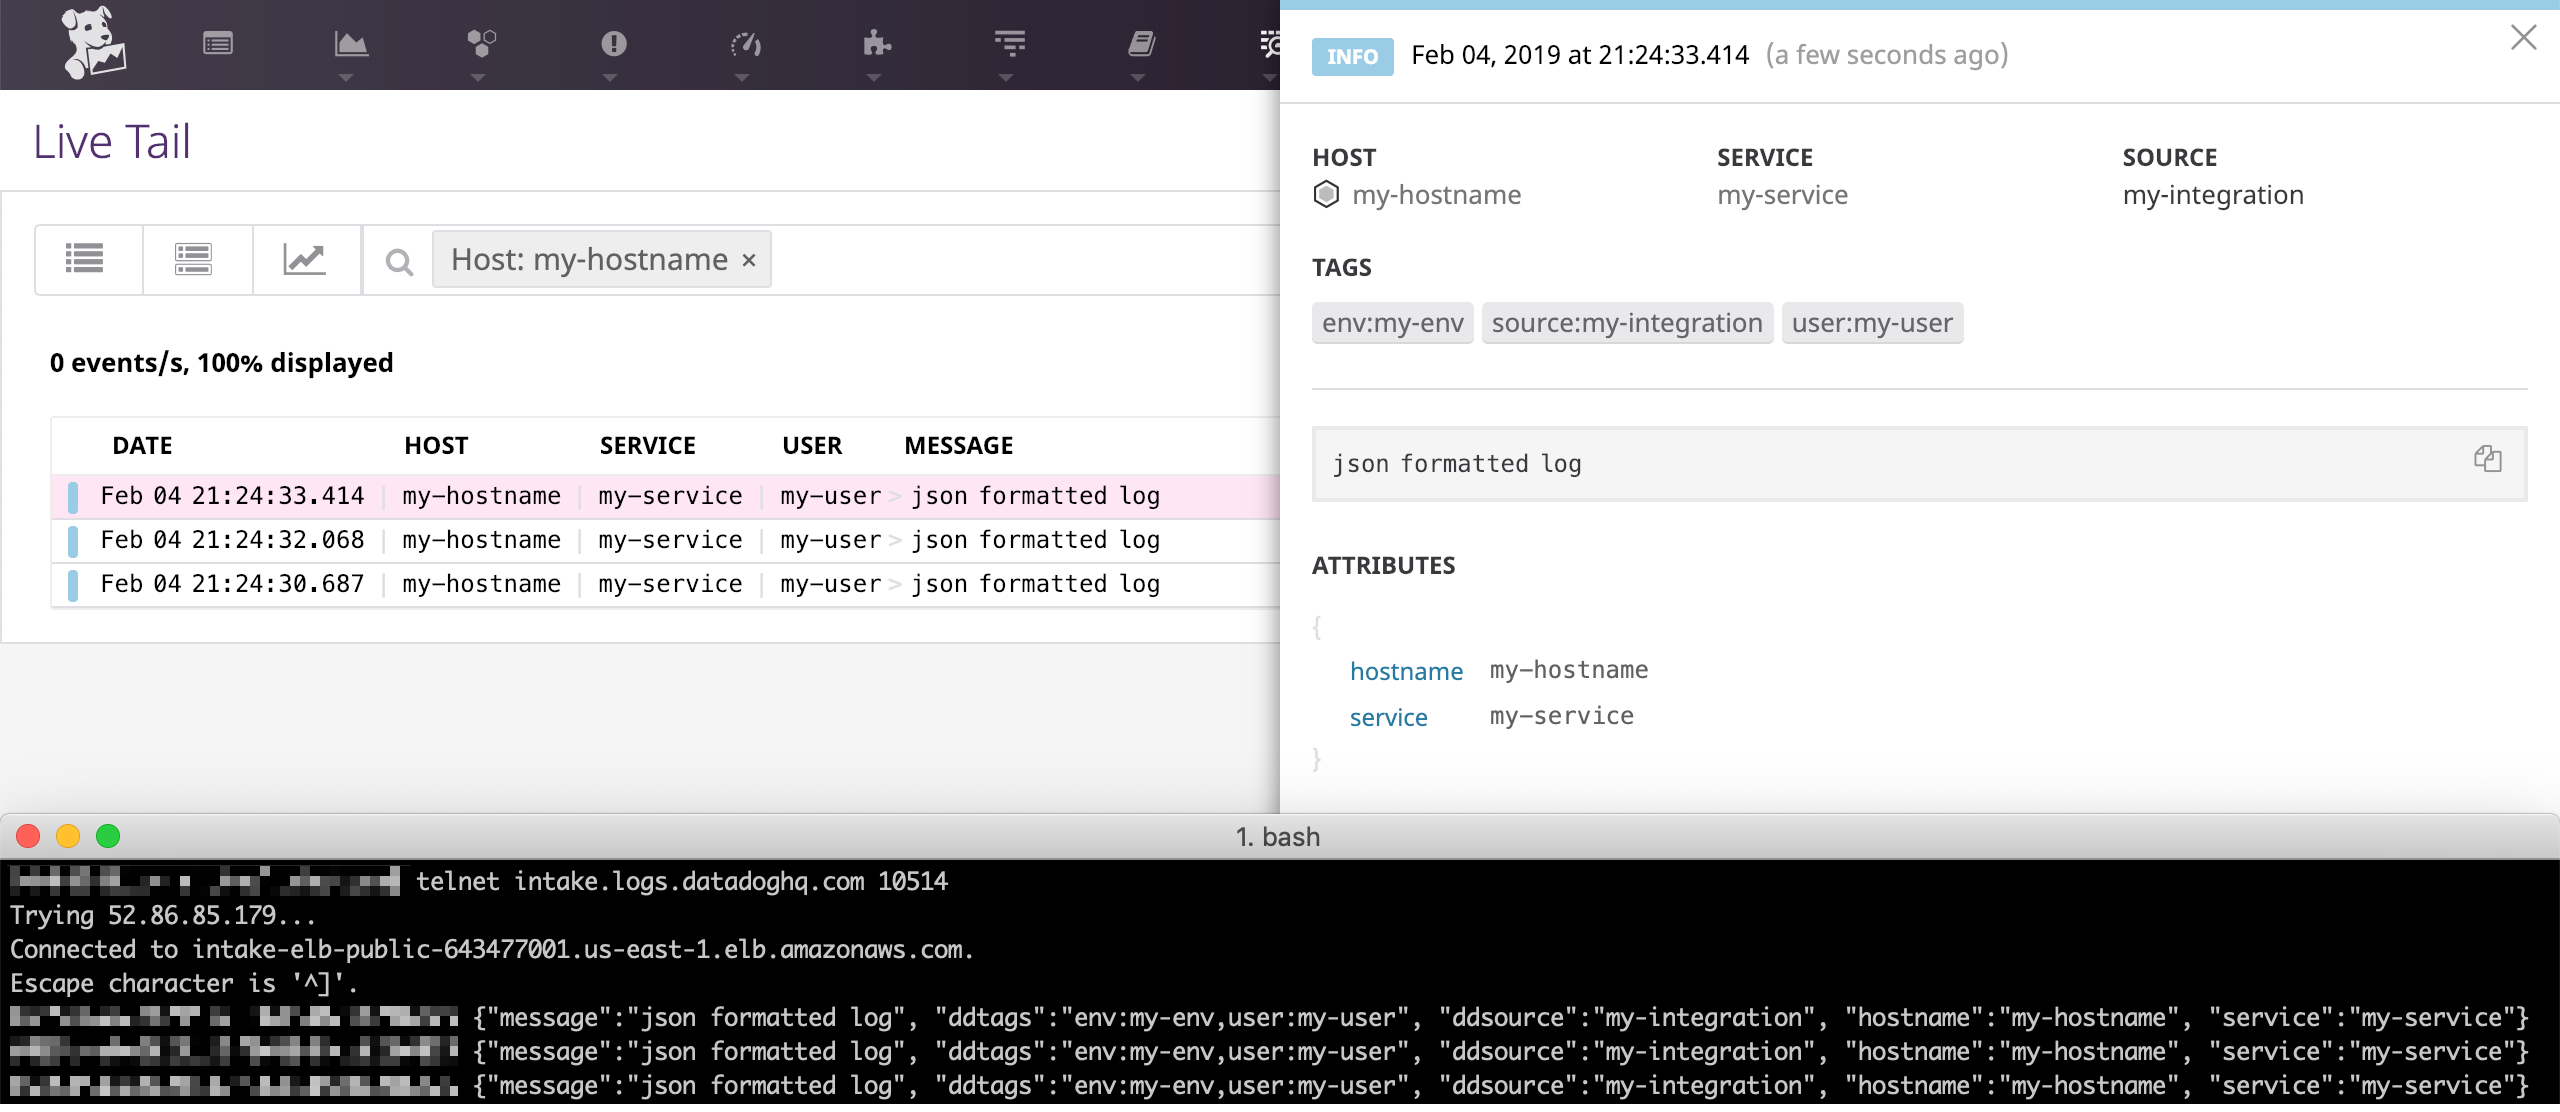
This produces the following result in your live tail page:
In case of a <PAYLOAD> in JSON format, Datadog automatically parses
its attributes:
telnet intake.logs.datadoghq.com 10514
<DATADOG_API_KEY> {"message":"json formatted log", "ddtags":"env:my-env,user:my-user", "ddsource":"my-integration", "hostname":"my-hostname", "service":"my-service"}
Datadog Logs Endpoints
Datadog provides logging endpoints for both SSL-encrypted connections and unencrypted connections. Use the encrypted endpoint when possible. The Datadog Agent uses the encrypted endpoint to send logs to Datadog. More information is available in the Datadog security documentation.
Endpoints that can be used to send logs to Datadog US region:
<table> <caption>ENCRYPTED Endpoints</caption> <col width="33%" /> <col width="33%" /> <col width="33%" /> <tbody> <tr class="odd"> <td align="left"><p>ENDPOINTS FOR SSL ENCRYPTED CONNECTIONS</p></td> <td align="left"><p>PORT</p></td> <td align="left"><p>DESCRIPTION</p></td> </tr> <tr class="even"> <td align="left"><p><code>agent-intake.logs.datadoghq.com</code></p></td> <td align="left"><p><code>10516</code></p></td> <td align="left"><p>Used by the Agent to send logs in protobuf format over an SSL-encrypted TCP connection</p></td> </tr> <tr class="odd"> <td align="left"><p><code>agent-http-intake.logs.datadoghq.com</code></p></td> <td align="left"><p><code>443</code></p></td> <td align="left"><p>Used by the Agent to send logs in JSON format over HTTPS. See the How to send logs over HTTP documentation.</p></td> </tr> <tr class="even"> <td align="left"><p><code>http-intake.logs.datadoghq.com</code></p></td> <td align="left"><p><code>443</code></p></td> <td align="left"><p>Used by custom forwarder to send logs in JSON or plain text format over HTTPS. See the How to send logs over HTTP documentation.</p></td> </tr> <tr class="odd"> <td align="left"><p><code>intake.logs.datadoghq.com</code></p></td> <td align="left"><p><code>10516</code></p></td> <td align="left"><p>Used by custom forwarders to send logs in raw, Syslog, or JSON format over an SSL-encrypted TCP connection.</p></td> </tr> <tr class="even"> <td align="left"><p><code>lambda-intake.logs.datadoghq.com</code></p></td> <td align="left"><p><code>10516</code></p></td> <td align="left"><p>Used by Lambda functions to send logs in raw, Syslog, or JSON format over an SSL-encrypted TCP connection.</p></td> </tr> <tr class="odd"> <td align="left"><p><code>lambda-http-intake.logs.datadoghq.com</code></p></td> <td align="left"><p><code>443</code></p></td> <td align="left"><p>Used by Lambda functions to send logs in raw, Syslog, or JSON format over HTTPS.</p></td> </tr> <tr class="even"> <td align="left"><p><code>functions-intake.logs.datadoghq.com</code></p></td> <td align="left"><p><code>10516</code></p></td> <td align="left"><p>Used by Azure functions to send logs in raw, Syslog, or JSON format over an SSL-encrypted TCP connection. Note: This endpoint may be useful with other cloud providers.</p></td> </tr> </tbody> </table> <table> <caption>UNENCRYPTED Endpoints</caption> <col width="33%" /> <col width="33%" /> <col width="33%" /> <tbody> <tr class="odd"> <td align="left"><p>ENDPOINT FOR UNENCRYPTED CONNECTIONS</p></td> <td align="left"><p>PORT</p></td> <td align="left"><p>DESCRIPTION</p></td> </tr> <tr class="even"> <td align="left"><p><code>intake.logs.datadoghq.com</code></p></td> <td align="left"><p><code>10514</code></p></td> <td align="left"><p>Used by custom forwarders to send logs in raw, Syslog, or JSON format over an unecrypted TCP connection.</p></td> </tr> </tbody> </table>Reserved attributes
Note
As a best practice for log collection, Datadog recommends using unified service tagging when assigning tags and environment variables. Unified service tagging ties Datadog telemetry together through the use of three standard tags:
env,service, andversion. To learn how to configure your environment with unified tagging, refer to the dedicated unified service tagging documentation.
Here are some key attributes you should pay attention to when setting up your project:
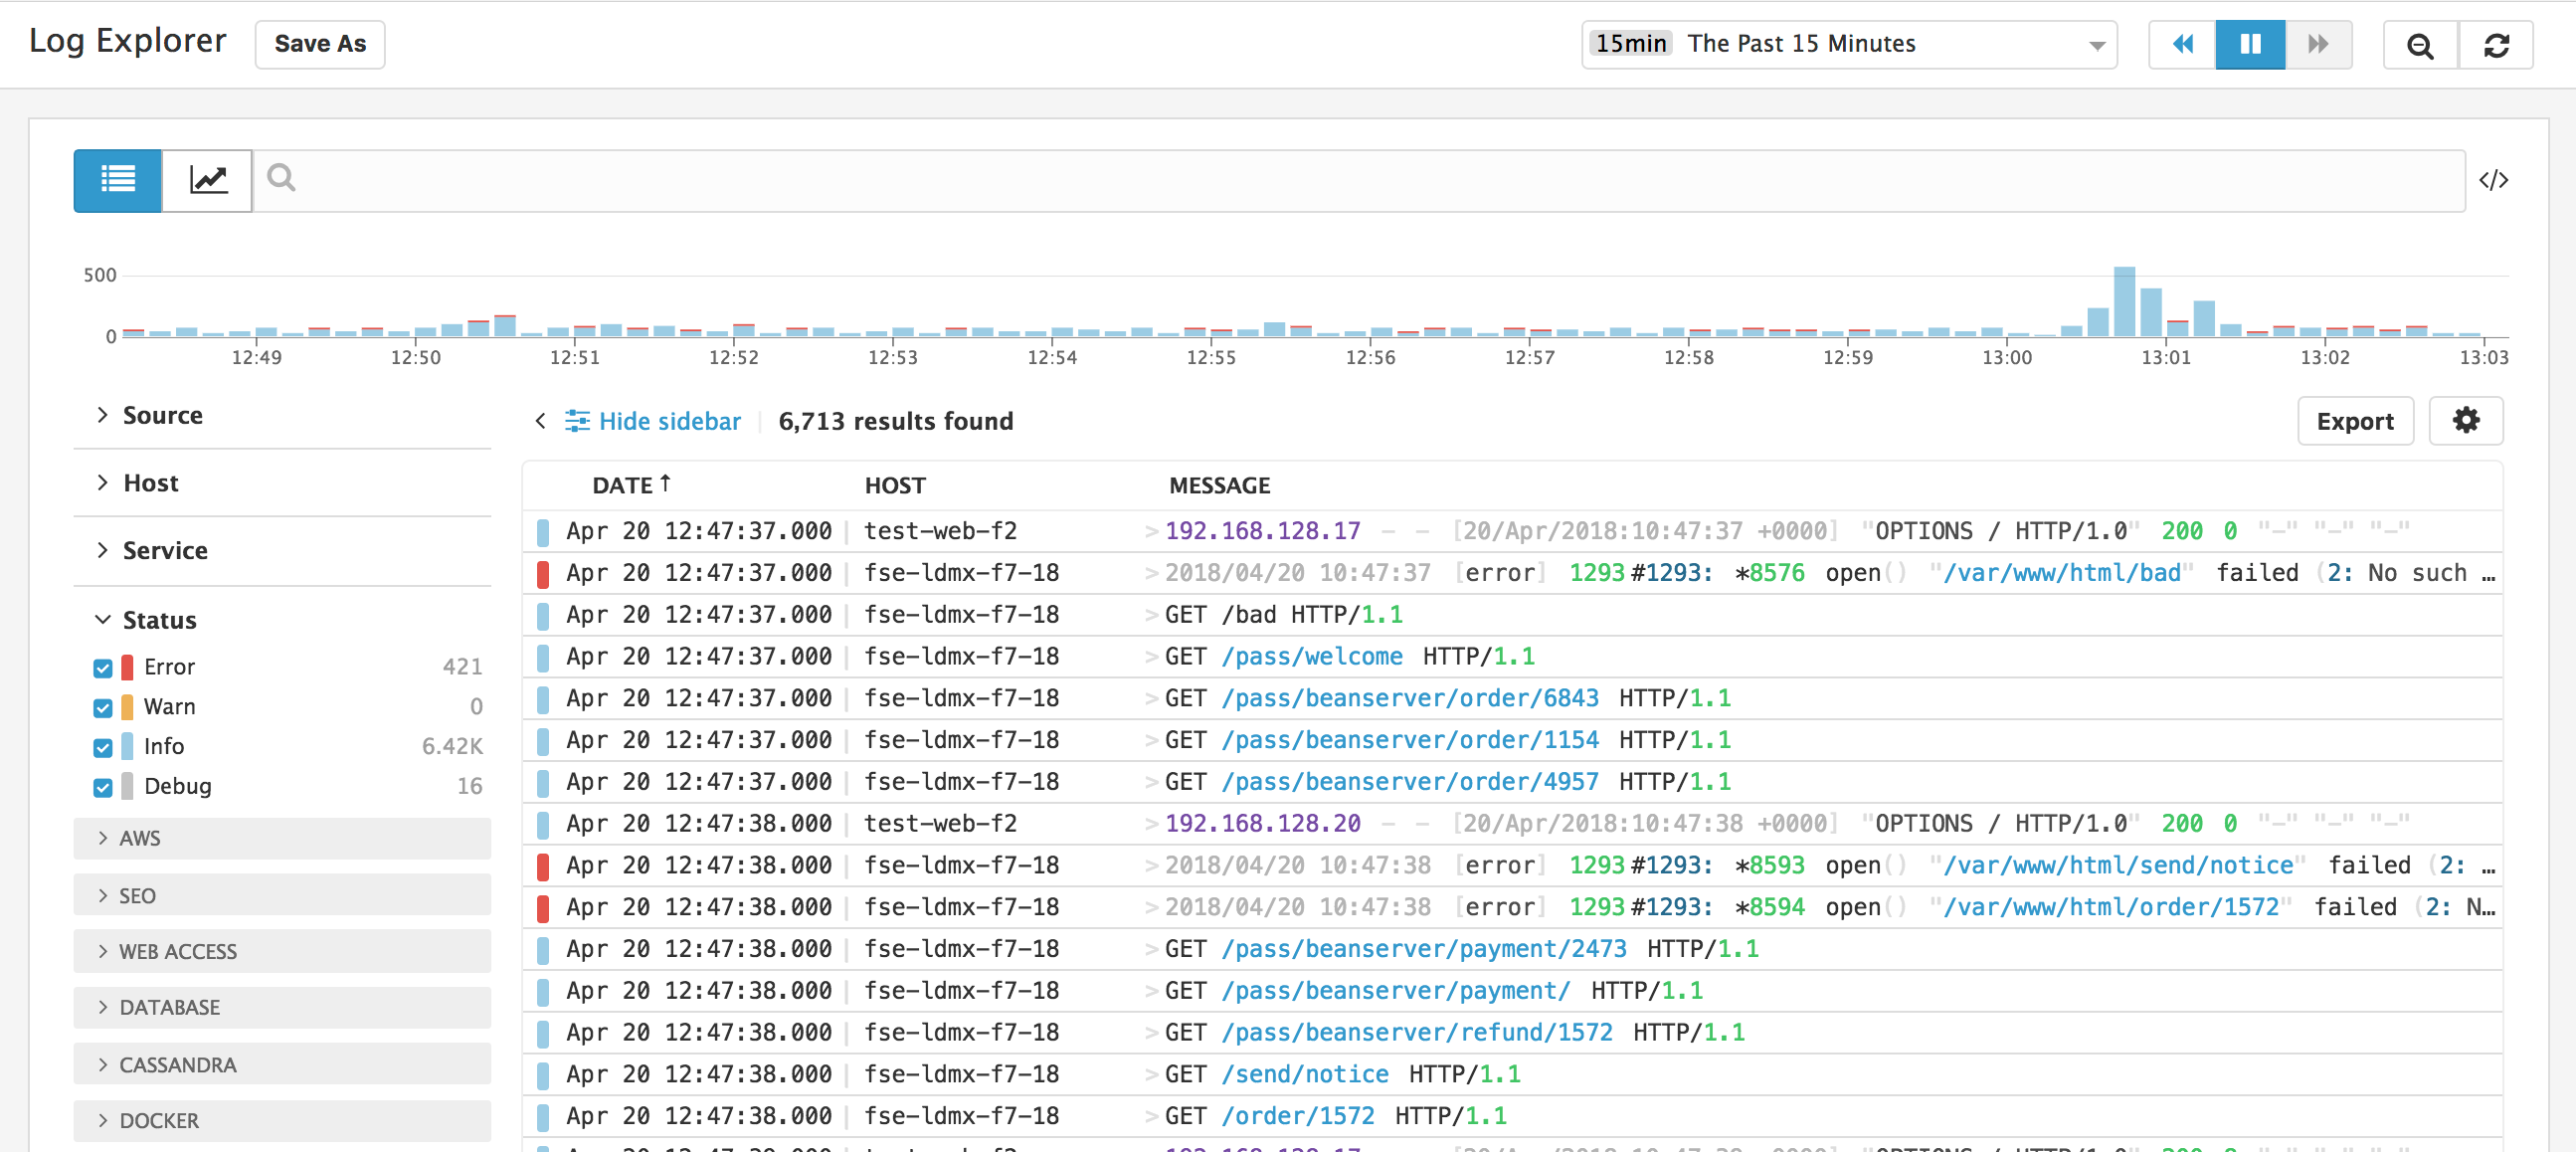
<table> <col width="50%" /> <col width="50%" /> <tbody> <tr class="odd"> <td align="left"><p>ATTRIBUTE</p></td> <td align="left"><p>DESCRIPTION</p></td> </tr> <tr class="even"> <td align="left"><p><code>host</code></p></td> <td align="left"><p>The name of the originating host as defined in metrics. We automatically retrieve corresponding host tags from the matching host in Datadog and apply them to your logs. The Agent sets this value automatically.</p></td> </tr> <tr class="odd"> <td align="left"><p><code>source</code></p></td> <td align="left"><p>This corresponds to the integration name: the technology from which the log originated. When it matches an integration name, Datadog automatically installs the corresponding parsers and facets. For example: nginx, postgresql, etc.</p></td> </tr> <tr class="even"> <td align="left"><p><code>status</code></p></td> <td align="left"><p>This corresponds to the level/severity of a log. It is used to define patterns and has a dedicated layout in the Datadog Log UI.</p></td> </tr> <tr class="odd"> <td align="left"><p><code>service</code></p></td> <td align="left"><p>The name of the application or service generating the log events. It is used to switch from Logs to APM, so make sure you define the same value when you use both products.</p></td> </tr> <tr class="even"> <td align="left"><p><code>message</code></p></td> <td align="left"><p>By default, Datadog ingests the value of the message attribute as the body of the log entry. That value is then highlighted and displayed in the Logstream, where it is indexed for full text search.</p></td> </tr> </tbody> </table>Your logs are collected and centralized into the Log Explorer view. You can also search, enrich, and alert on your logs.
How to get the most of your application logs
When logging stack traces, there are specific attributes that have a dedicated UI display within your Datadog application such as the logger name, the current thread, the error type, and the stack trace itself.
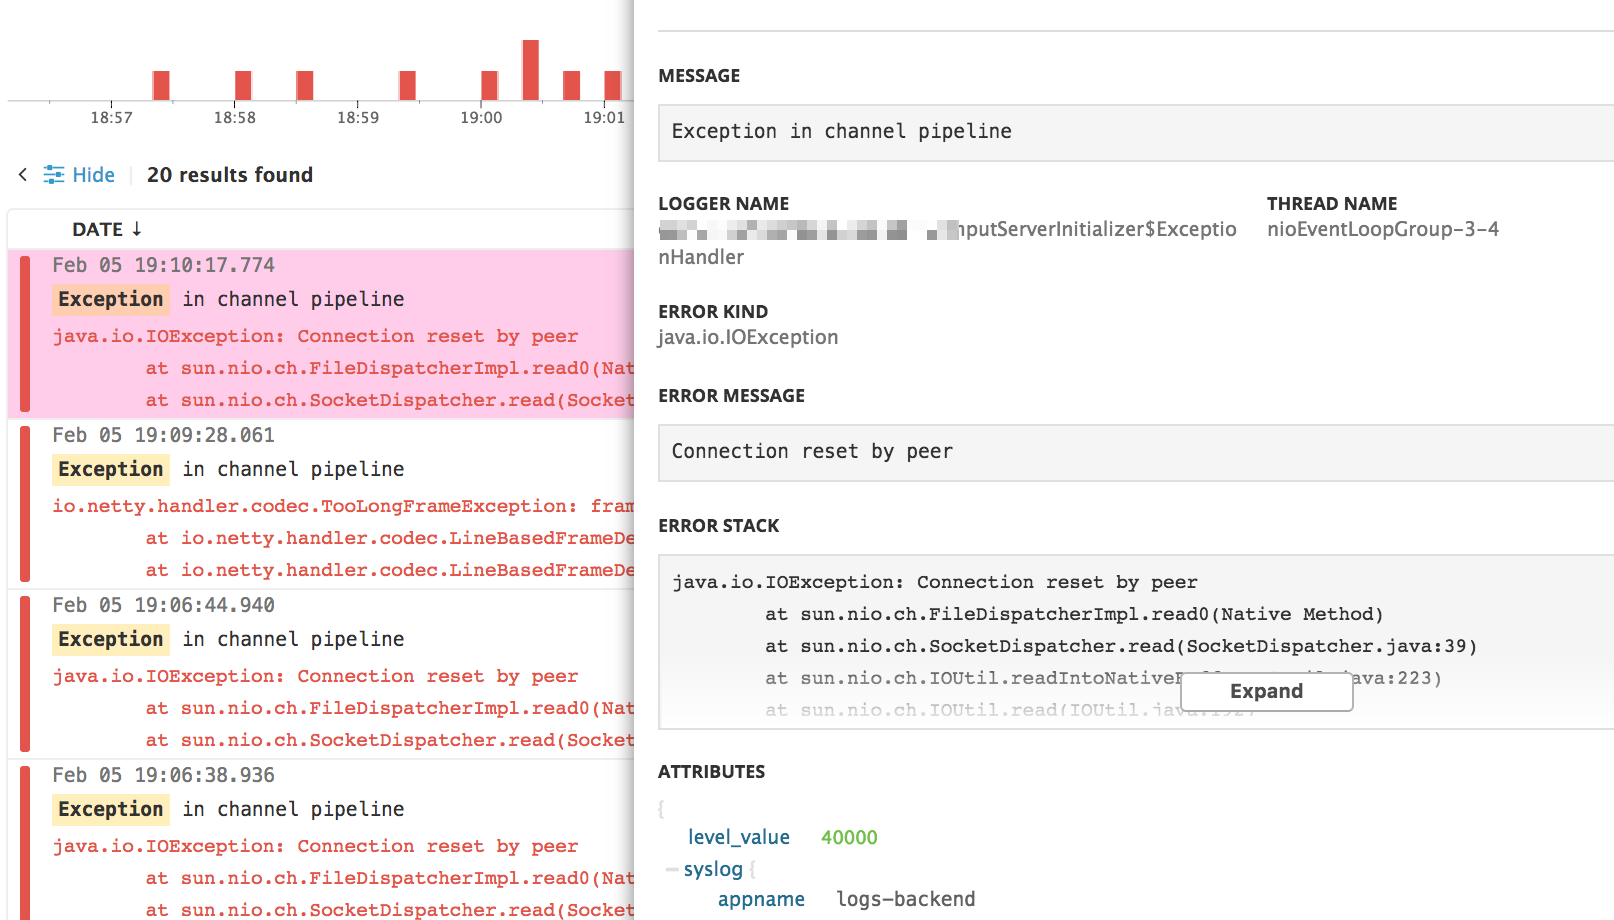
To enable these functionalities use the following attribute names:
<table> <col width="50%" /> <col width="50%" /> <tbody> <tr class="odd"> <td align="left"><p>ATTRIBUTE</p></td> <td align="left"><p>DESCRIPTION</p></td> </tr> <tr class="even"> <td align="left"><p><code>logger.name</code></p></td> <td align="left"><p>Name of the logger</p></td> </tr> <tr class="odd"> <td align="left"><p><code>logger.thread_name</code></p></td> <td align="left"><p>Name of the current thread</p></td> </tr> <tr class="even"> <td align="left"><p><code>error.stack</code></p></td> <td align="left"><p>Actual stack trace</p></td> </tr> <tr class="odd"> <td align="left"><p><code>error.message</code></p></td> <td align="left"><p>Error message contained in the stack trace</p></td> </tr> <tr class="even"> <td align="left"><p><code>error.kind</code></p></td> <td align="left"><p>The type or “kind” of an error (i.e “Exception”, “OSError”, …)</p></td> </tr> </tbody> </table>Note
By default, integration Pipelines attempt to remap default logging library parameters to those specific attributes and parse stack traces or traceback to automatically extract the
error.messageanderror.kind.
Send your application logs in JSON
For integration frameworks, Datadog provides guidelines on how to log JSON into a file. JSON-formatted logging helps handle multi-line application logs, and is automatically parsed by Datadog.
The Advantage of Collecting JSON-formatted logs
Datadog automatically parses JSON-formatted logs. For this reason, if you have control over the log format you send to Datadog, it is recommended to format these logs as JSON to avoid the need for custom parsing rules.
