About MCaaS
APM
The APM UI provides many tools to troubleshoot application performance and correlate it throughout the product, which helps you find and resolve issues in highly distributed systems.
Services
After instrumenting your application, the Services List is your main landing page for APM data.
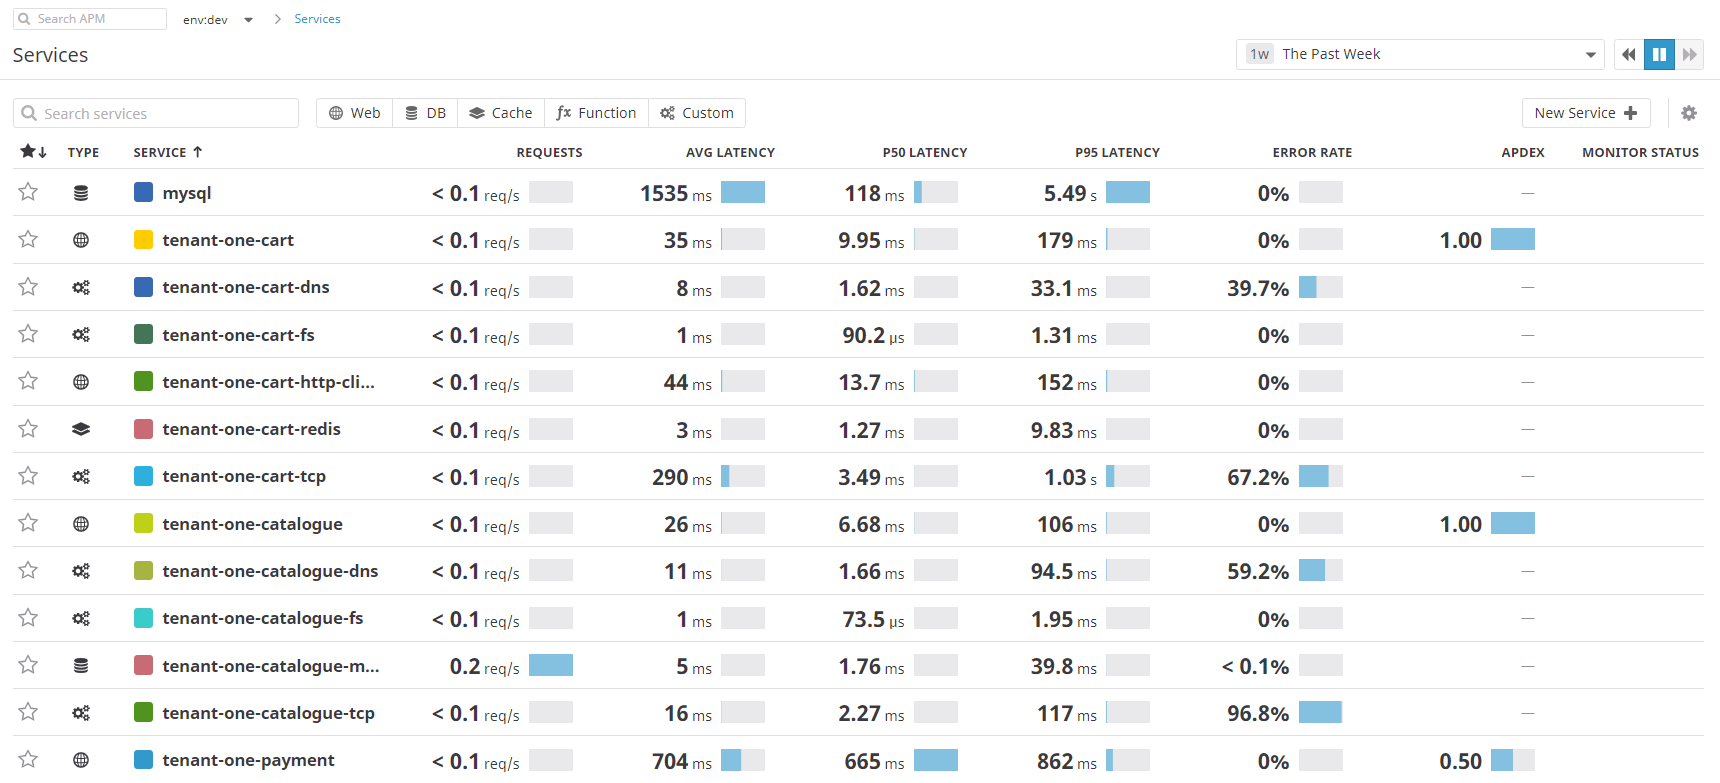
Services are the building blocks of modern microservice architectures - broadly a service groups together endpoints, queries, or jobs for the purposes of scaling instances. Some examples:
-
A group of URL endpoints may be grouped together under an API service.
-
A group of DB queries that are grouped together within one database service.
-
A group of periodic jobs configured in the crond service.
All services can be found in the Service List and visually represented on the Service Map. Each service has its own Service page where trace metrics like throughput, latency, and error rates can be viewed and inspected. Use these metrics to create dashboard widgets, create monitors, and see the performance of every resource such as a web endpoint or database query belonging to the service.

Resources
Resources represent a particular domain of a customer application. They
could typically be an instrumented web endpoint, database query, or
background job. For a web service, these resources can be dynamic web
endpoints that are grouped by a static span name - web.request. In a
database service, these would be database queries with the span name
db.query. For example the web-store service has automatically
instrumented resources - web endpoints - which handle checkouts,
updating_carts, add_item, etc. Each resource has its own Resource page
with trace metrics scoped to the specific endpoint. Trace metrics can be
used like any other Datadog metric - they are exportable to a dashboard
or can be used to create monitors. The Resource page also shows the span
summary widget with an aggregate view of spans for all traces, latency
distribution of requests, and traces which show requests made to this
endpoint.

Trace
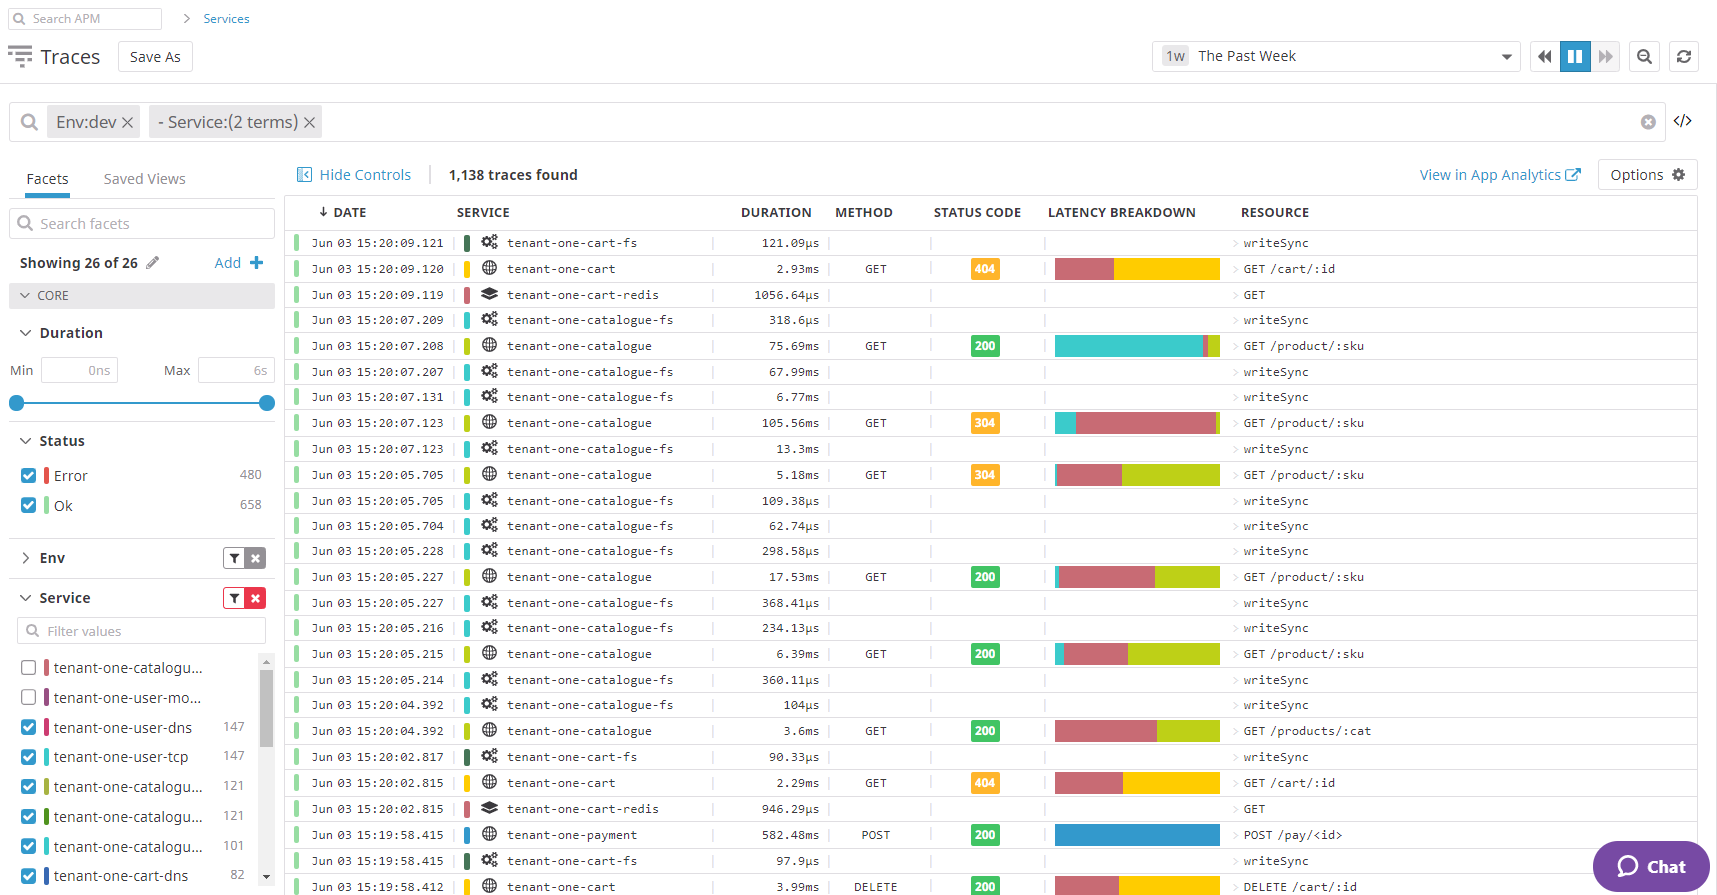
A trace is used to track the time spent by an application processing a request and the status of this request. Each trace consists of one or more spans. During the lifetime of the request, you can see distributed calls across services (because a trace-id is injected/extracted through HTTP headers, automatically instrumented libraries, and manual instrumentation using open-source tools like OpenTracing in the flamegraph view. In the Trace View page, each trace collects information that connects it to other parts of the platform, including connecting logs to traces, adding tags to spans, and collecting runtime metrics.
Spans
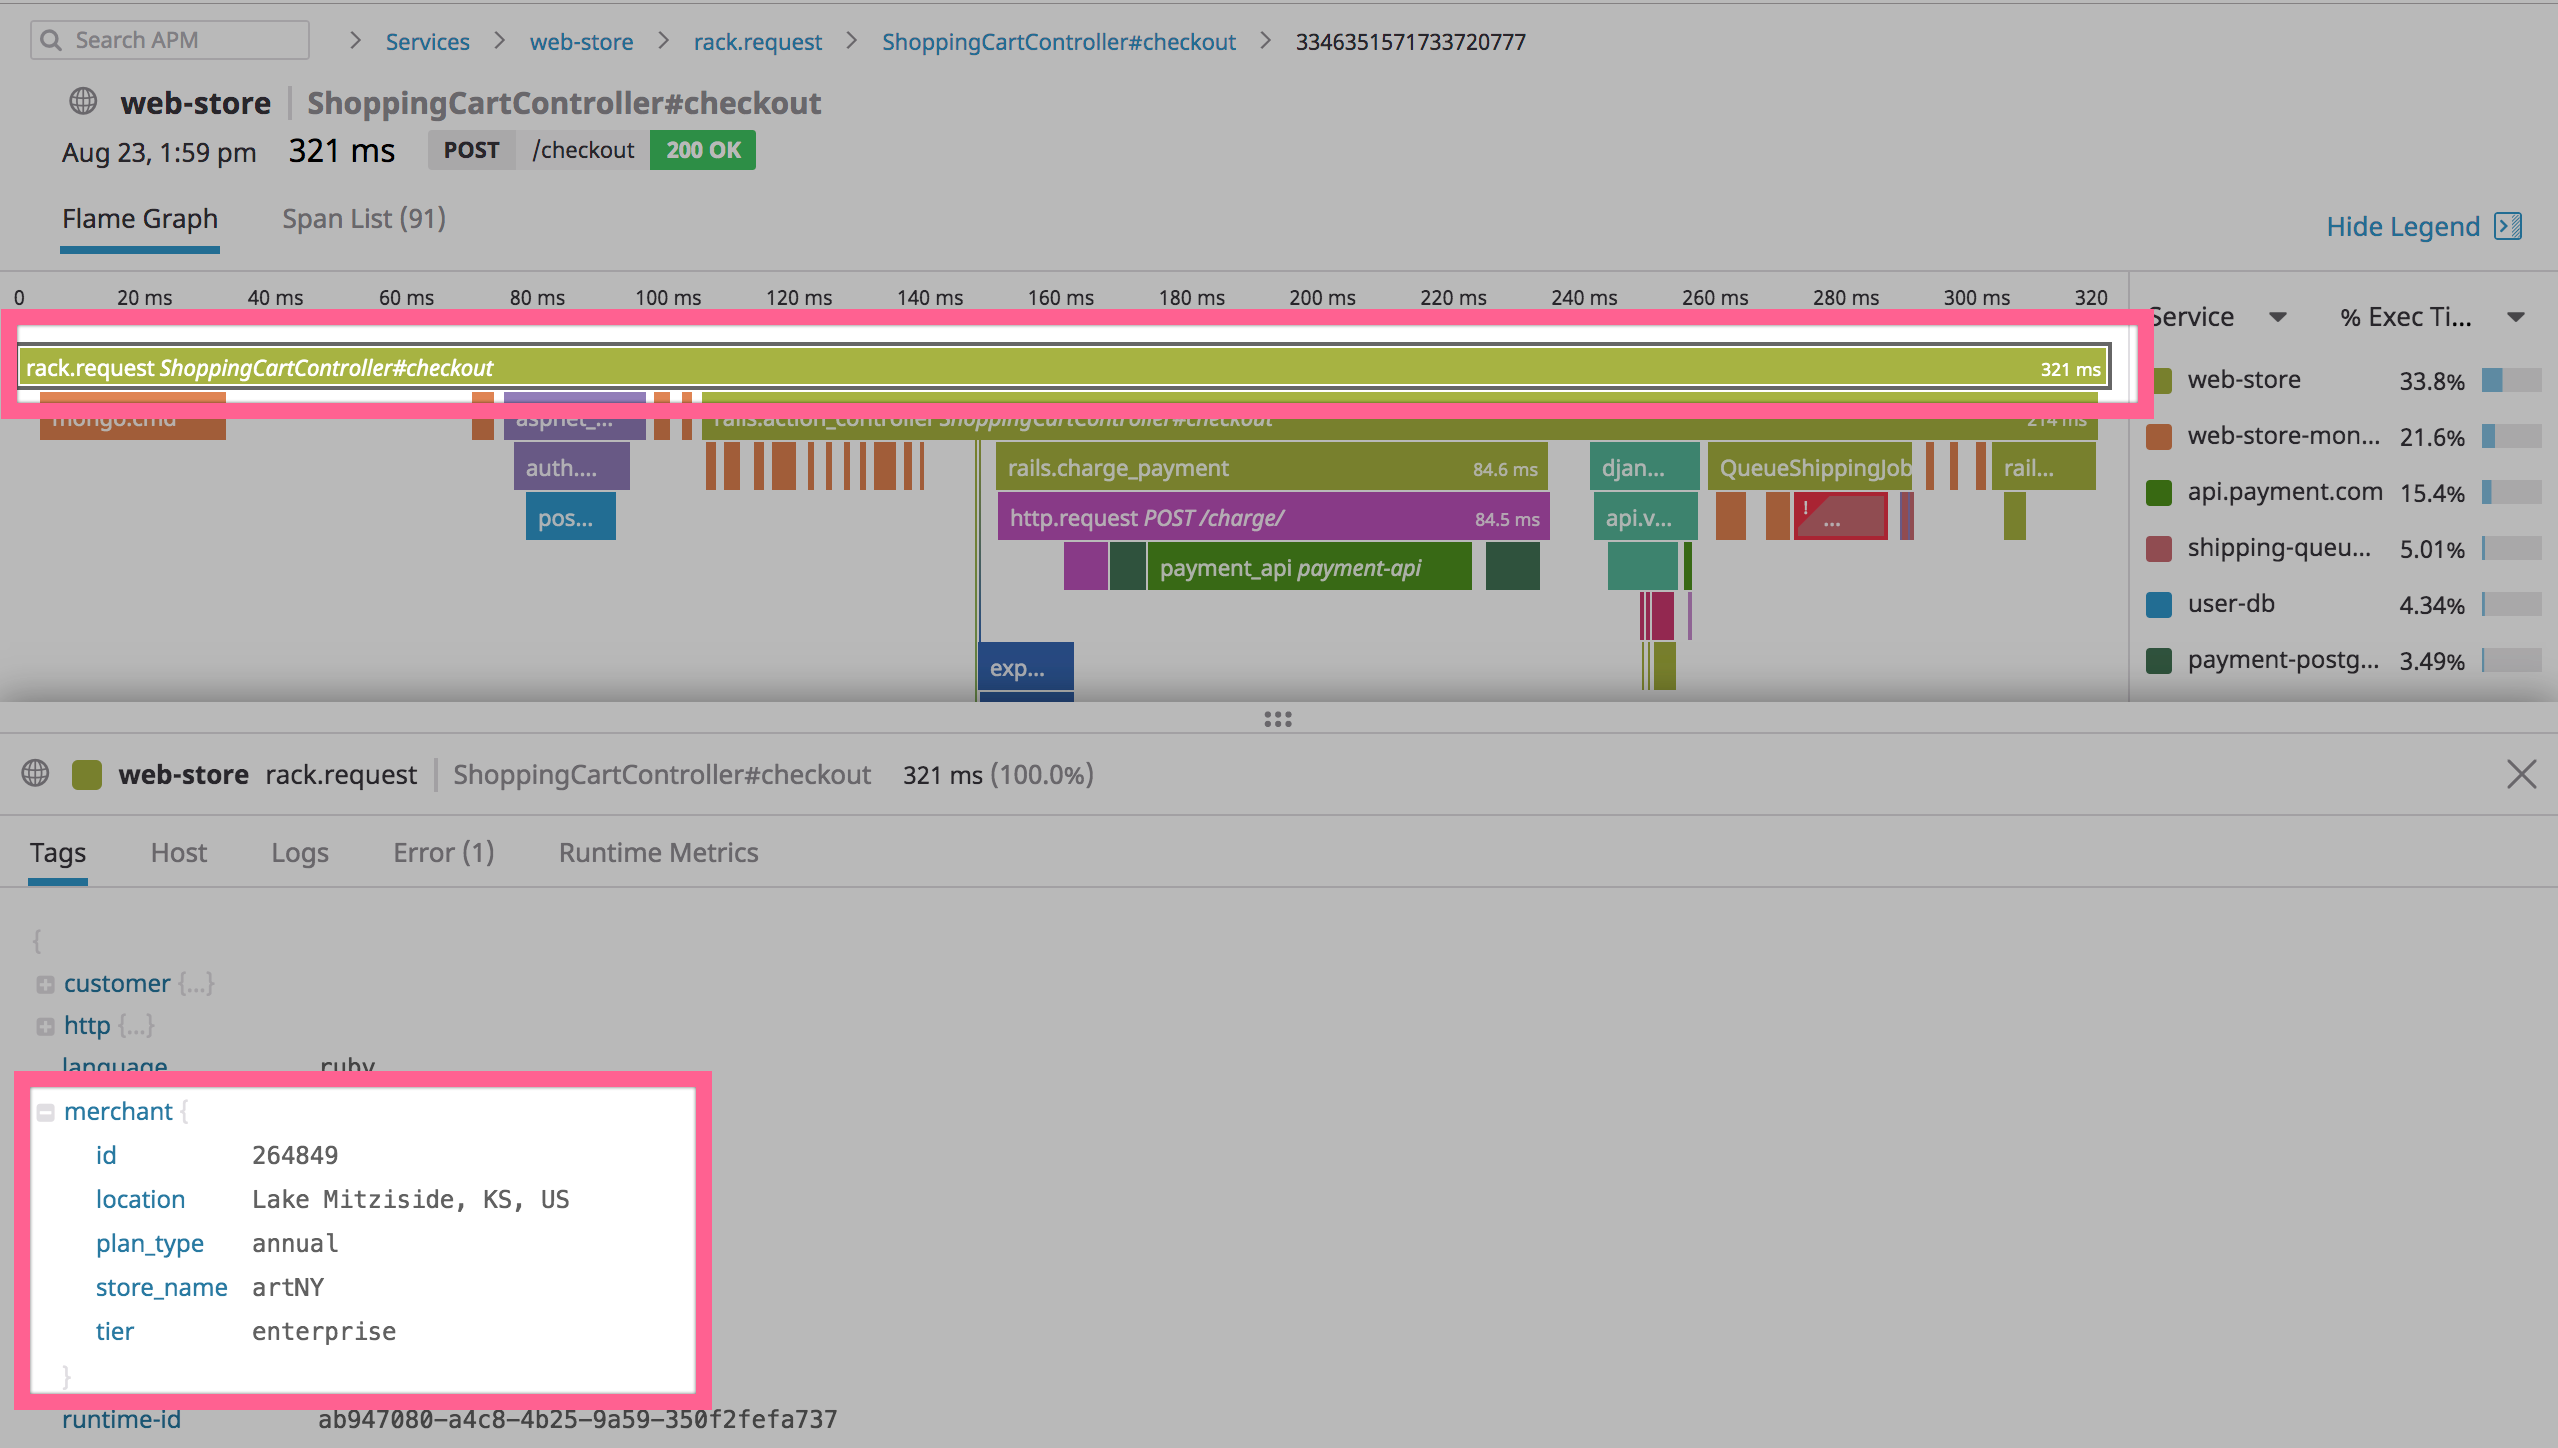
A span represents a logical unit of work in the system for a given time
period. Each span consists of a span.name, start time, duration, and
span tags. For example, a span can describe the time spent on a
distributed call on a separate machine, or the time spent in a small
component within a larger request. Spans can be nested within each
other, which creates a parent-child relationship between the spans.
For the example below, the span rack.request is the entry-point span
of the trace. This means the web-store service page is displaying
resources that consist of traces with an entry-point span named
rack.request. The example also shows the tags added application side
(merchant.name, merchant.tier, etc). These user-defined tags can be
used to search and analyze APM data in [App Analytics][14].
Trace Metrics
Trace metrics are automatically collected and kept at a 15-month
retention policy similar to any other Datadog metric. They can be used
to identify and alert on hits, errors, or latency. Trace metrics are
tagged by the host receiving traces along with the service or resource.
For example, after instrumenting a web service trace metrics are
collected for the entry-point span web.request in the Metric Summary.

Dashboard
Trace metrics can be exported to a dashboard from the Service or Resource page. Additionally, trace metrics can be queried from an existing dashboard.

Monitoring
Trace metrics are useful for monitoring. APM monitors can be set up on the New Monitors, Service, or Resource page. A set of suggested monitors is available on the Service, or Resource page.

App Analytics
App Analytics is used to filter Analyzed Spans by user-defined tags (customer_id, error_type, app_name, etc.) or infrastructure tags. This allows deep exploration of the web requests flowing through your service along with being able to search, graph, and monitor on 100% throughput of hits, errors, and latency. This feature can be enabled with automatic configuration.
Analyzed Span
Analyzed Spans represent 100% throughput of a request and can be used to
search, query, and monitor in App Analytics by the tags included on the
span. After enabling App Analytics, the tracing client analyzes an
entry-point span for web services by default, with the ability to
configure additional services in your application. For example, a Java
service with 100 requests generates 100 Analyzed Spans from its
servlet.request spans. If you set DD_TRACE_ANALYTICS_ENABLED=true
the web-store service analyzes all rack.request spans and makes them
available in App Analytics. For this example, you can graph the top 10
merchants highest latency in the 99th percentile. merchant_name is a
user defined tag that was applied to the span in the application.
Span tags
Tag spans in the form of key-value pairs to correlate a request in the
Trace View or filter in App Analytics. Tags can be added to a
single span or globally to all spans. For the example below, the
requests (merchant.store_name, merchant.tier, etc.) have been added
as tags to the span.
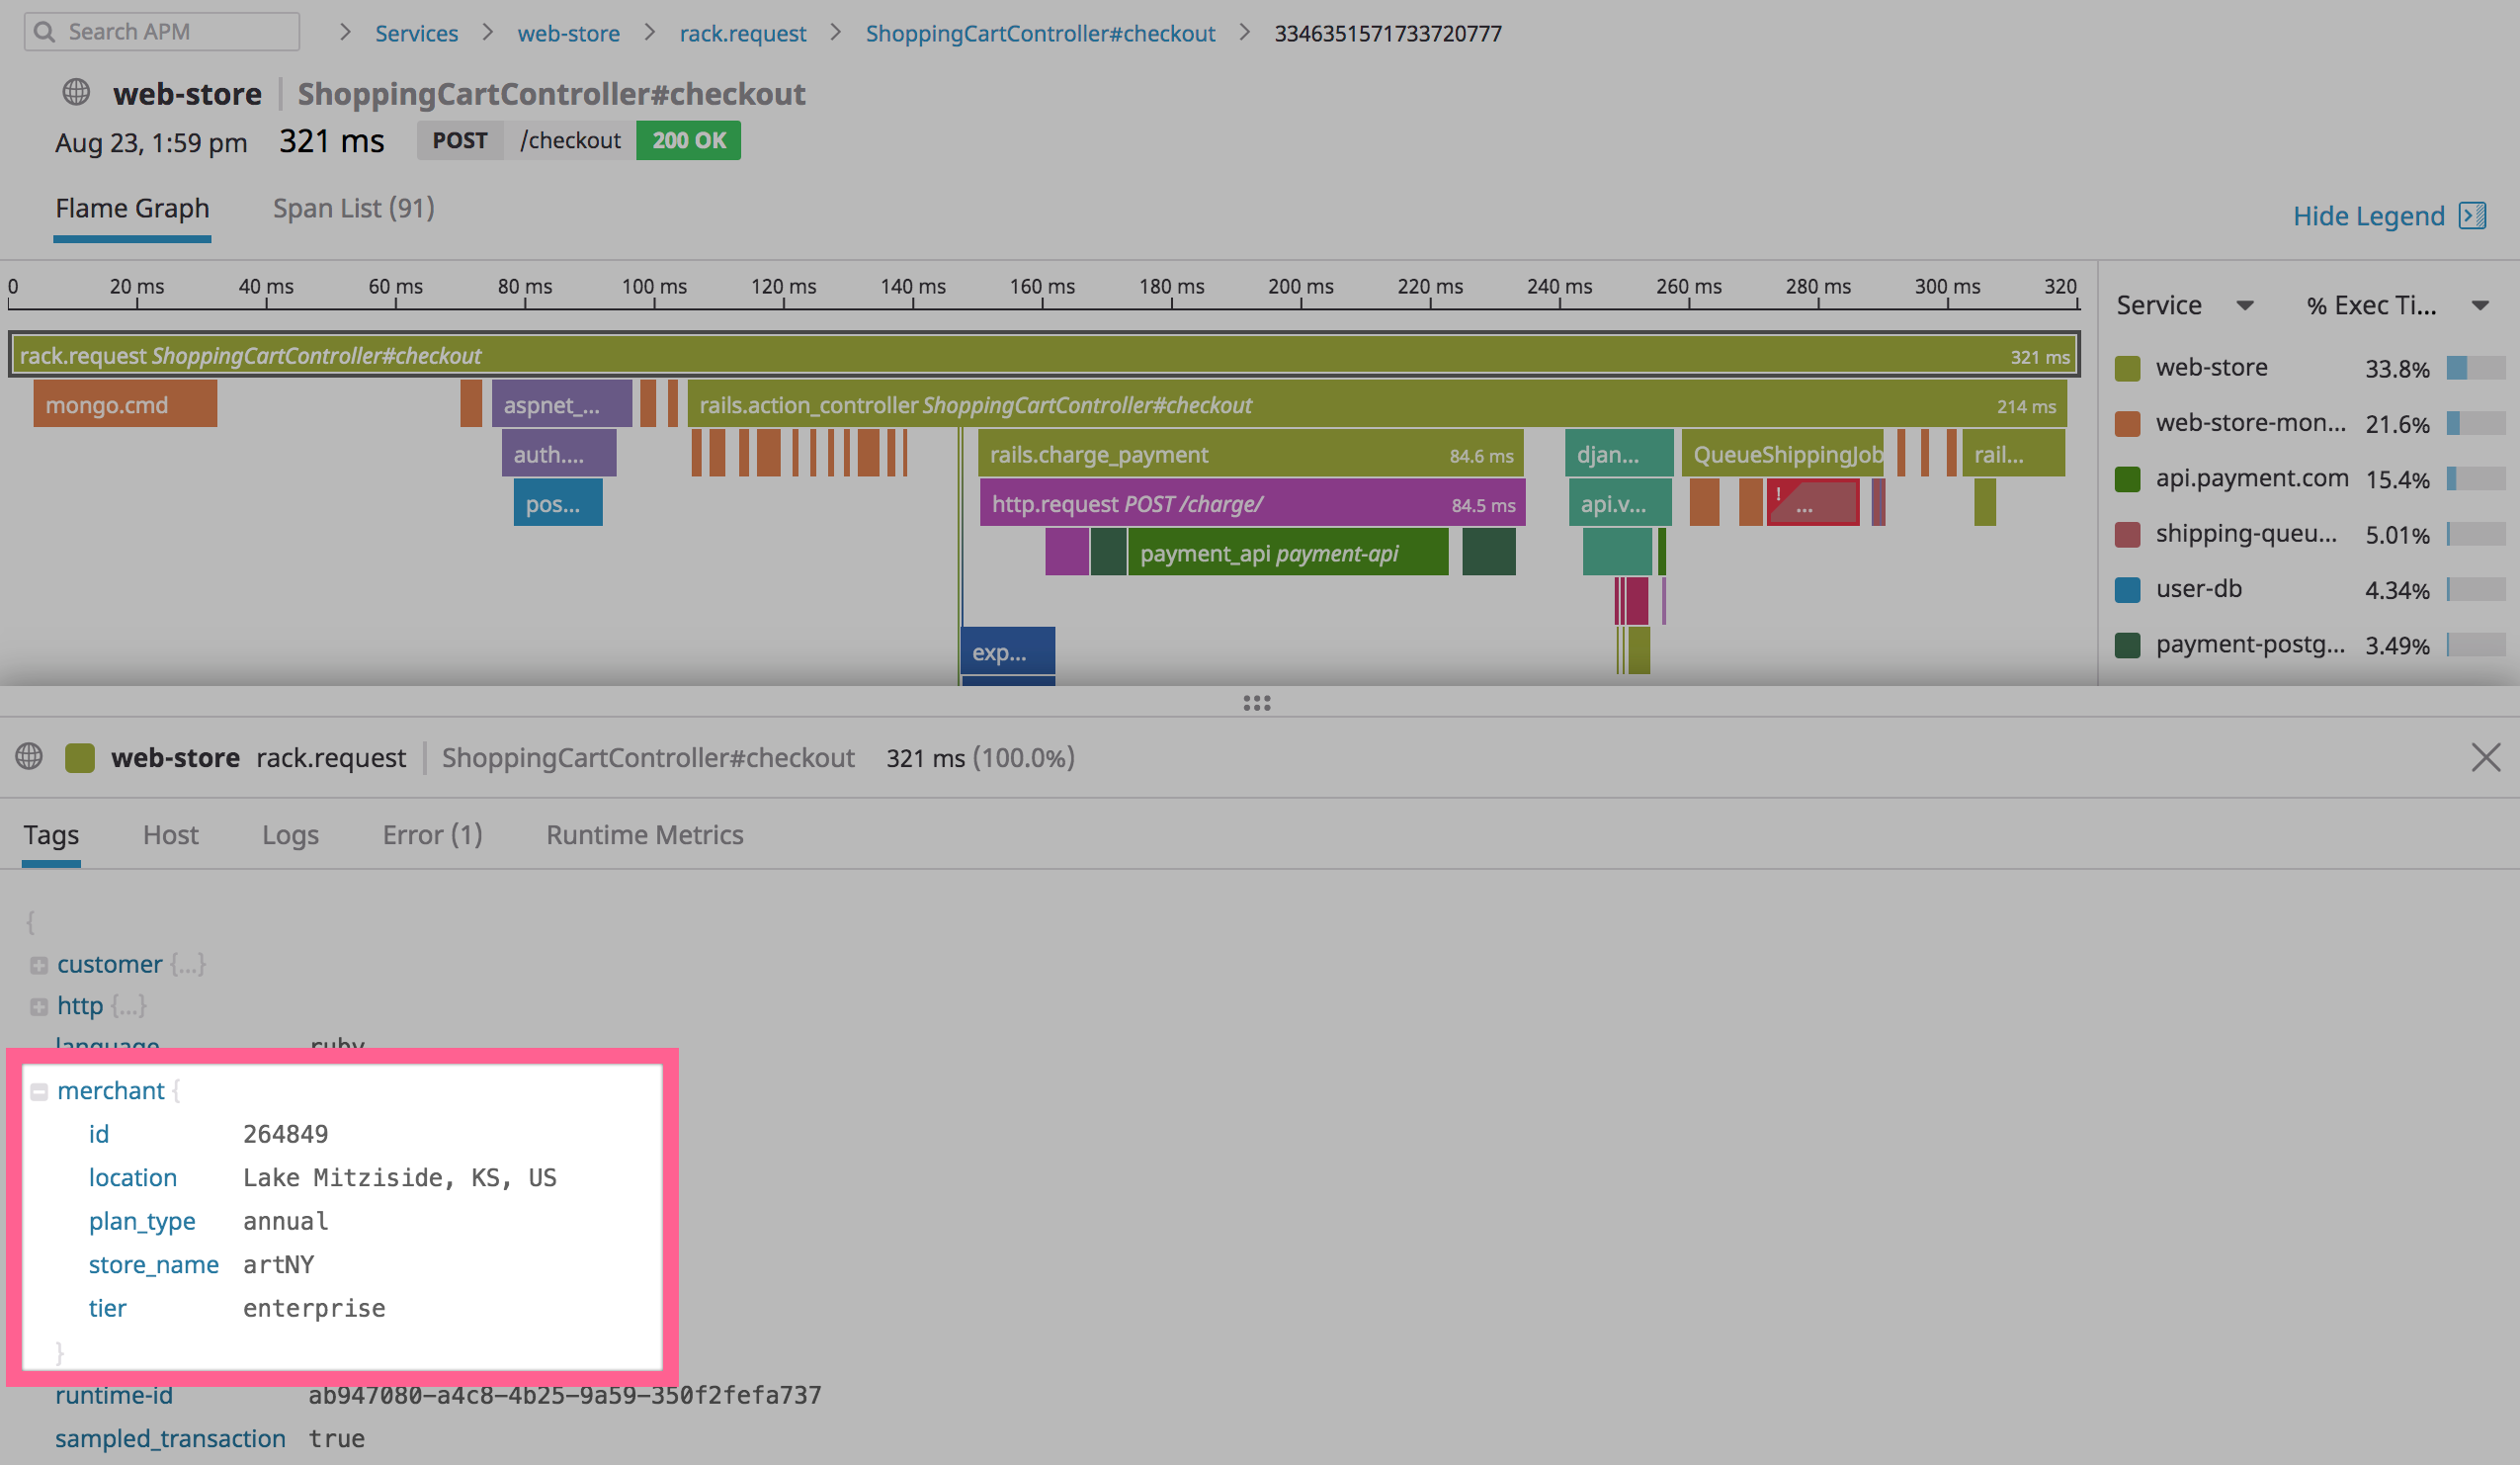
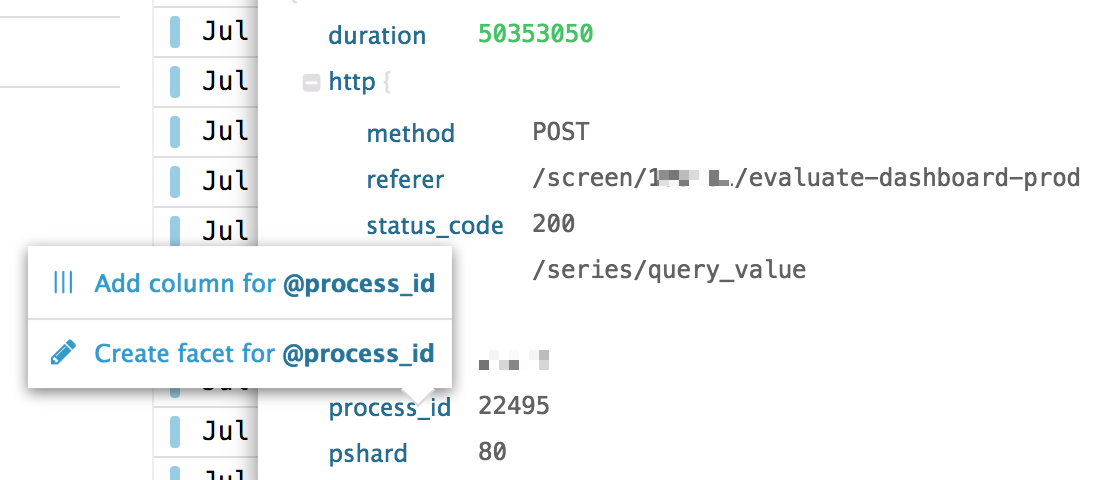
After a tag has been added to a span, search and query on the tag in App Analytics by clicking on the tag to add it as a facet. Once this is done, the value of this tag is stored for all new traces and can be used in the search bar, facet panel, and trace graph query.
