About MCaaS
Setup
Initial Setup
Once you’re logged in to Datadog, by default it should take you to the quick-start guide document, in case it doesn’t show up, feel free to copy the url from below and start/review the initial integrations.
`https://fcs-mcaas-<tenant-name>.ddog-gov.com/help/quick_start`
Instrumentation
Set up your application to send traces using one of the following official Datadog tracing libraries located here:






Note
More info can be found here:https://docs.datadoghq.com/tracing/setup/
Pod Tags
MCaaS added the following annotations to each pod that will show up as tags for logs, metrics, and traces. The values are gathered from the application’s Flux config.
<table> <caption>Available Pod Tags</caption> <col width="50%" /> <col width="50%" /> <tbody> <tr class="odd"> <td align="left"><p>Tag Name</p></td> <td align="left"><p>Tag Value from Flux Config</p></td> </tr> <tr class="even"> <td align="left"><p>tenant-short-code</p></td> <td align="left"><p>mcaasLabels tenantShortCode</p></td> </tr> <tr class="odd"> <td align="left"><p>module-short-code</p></td> <td align="left"><p>mcaasLabels moduleShortCode</p></td> </tr> <tr class="even"> <td align="left"><p>application-short-code</p></td> <td align="left"><p>mcaasLabels applicationShortCode</p></td> </tr> <tr class="odd"> <td align="left"><p>service</p></td> <td align="left"><p>mcaasLabels serviceShortCode</p></td> </tr> <tr class="even"> <td align="left"><p>env</p></td> <td align="left"><p>mcaasLabels environment</p></td> </tr> <tr class="odd"> <td align="left"><p>version</p></td> <td align="left"><p>generated image tag</p></td> </tr> </tbody> </table>In order to use these tags and any other tags to search logs, metrics,
and traces, input <Tag Name>:<Tag Value> into the search bar.
Integrations
-
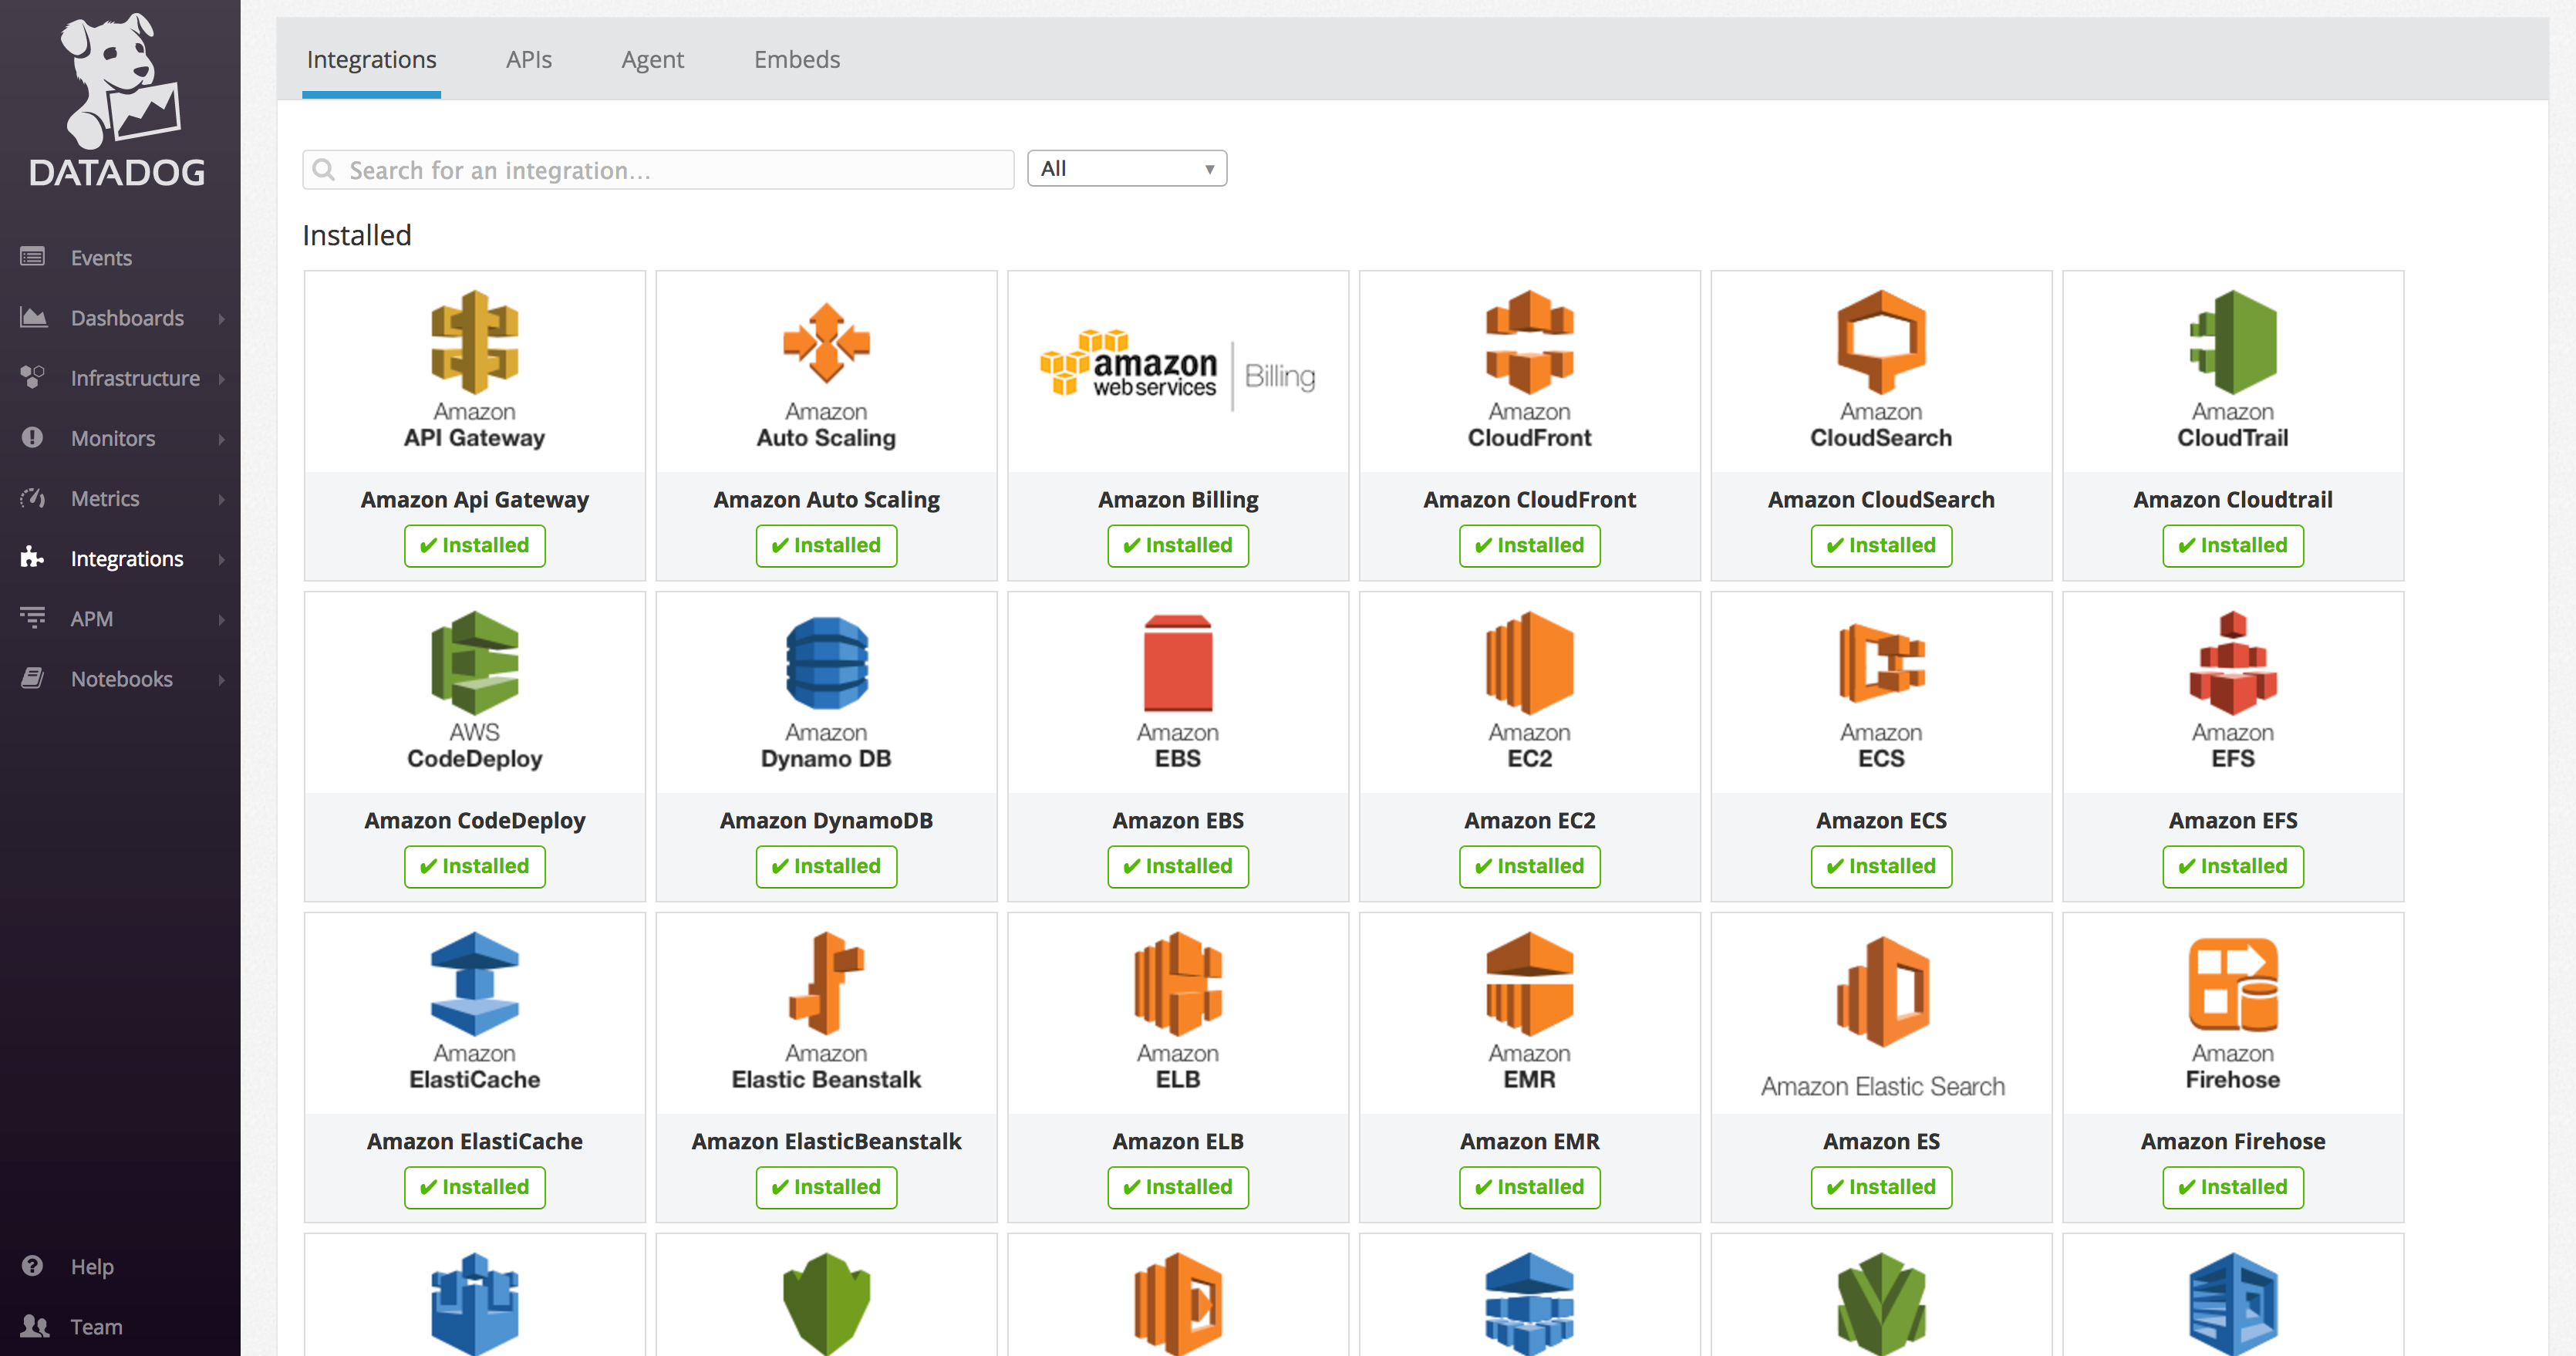
Datadog has over 400+ integrations officially listed.
-
Custom integrations are available via the Datadog API.
-
The Agent is open source.
-
Once integrations have been configured, all data is treated the same throughout Datadog, whether it is living in a datacenter or in an online service.
Log Management
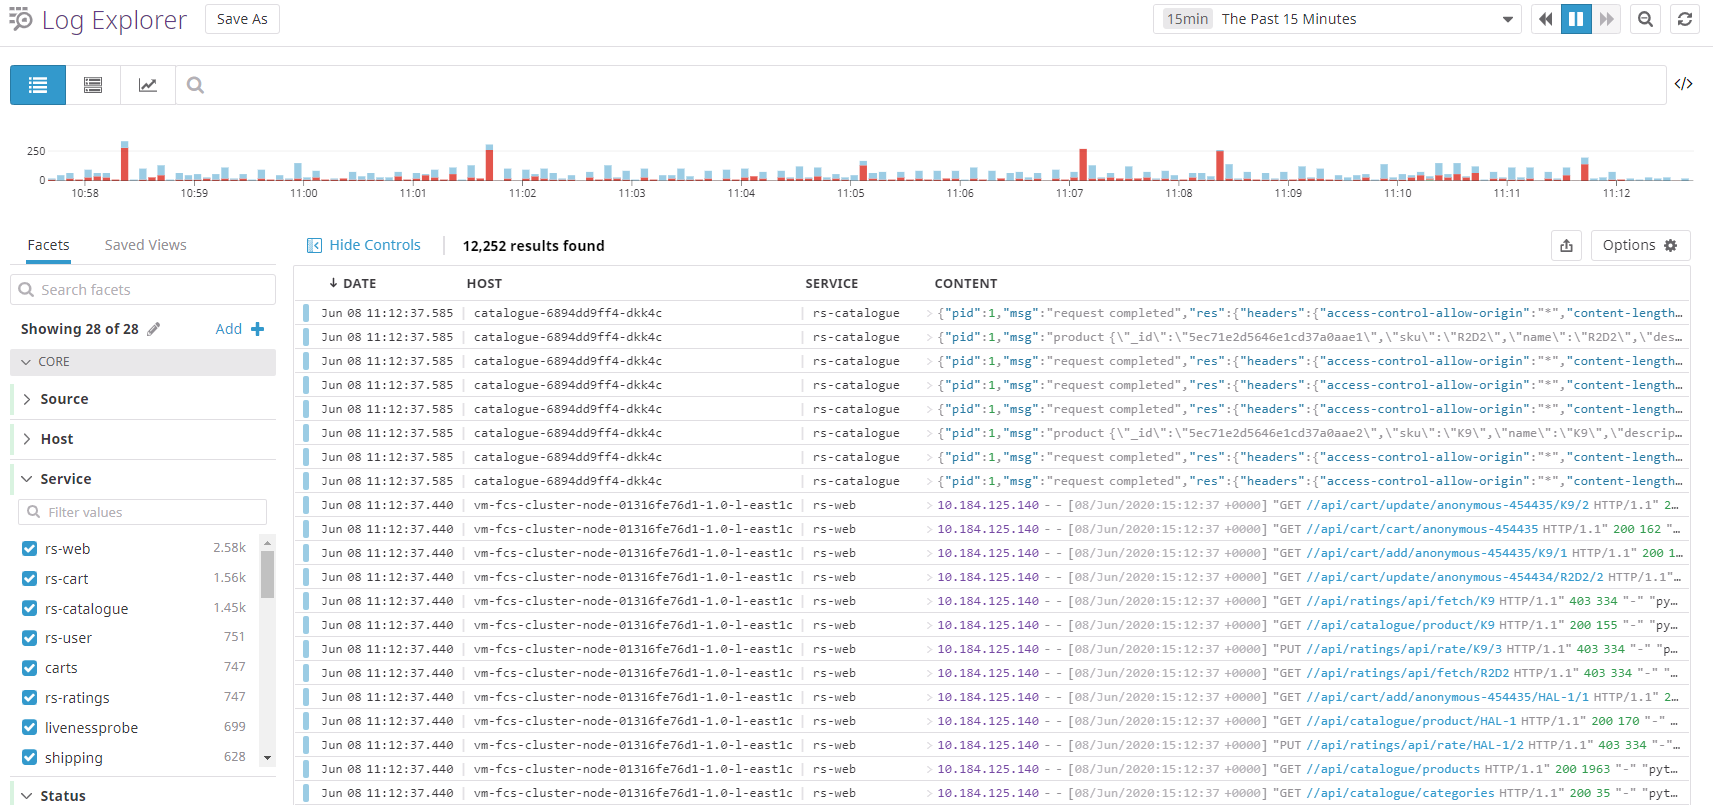
Datadog Log Management lets you send and process every log produced by your applications and infrastructure. You can observe your logs in real-time using the Live Tail, without indexing them. You can ingest all of the logs from your applications and infrastructure, decide what to index dynamically with filters, and then store them in an archive.
APM & Distributed Tracing
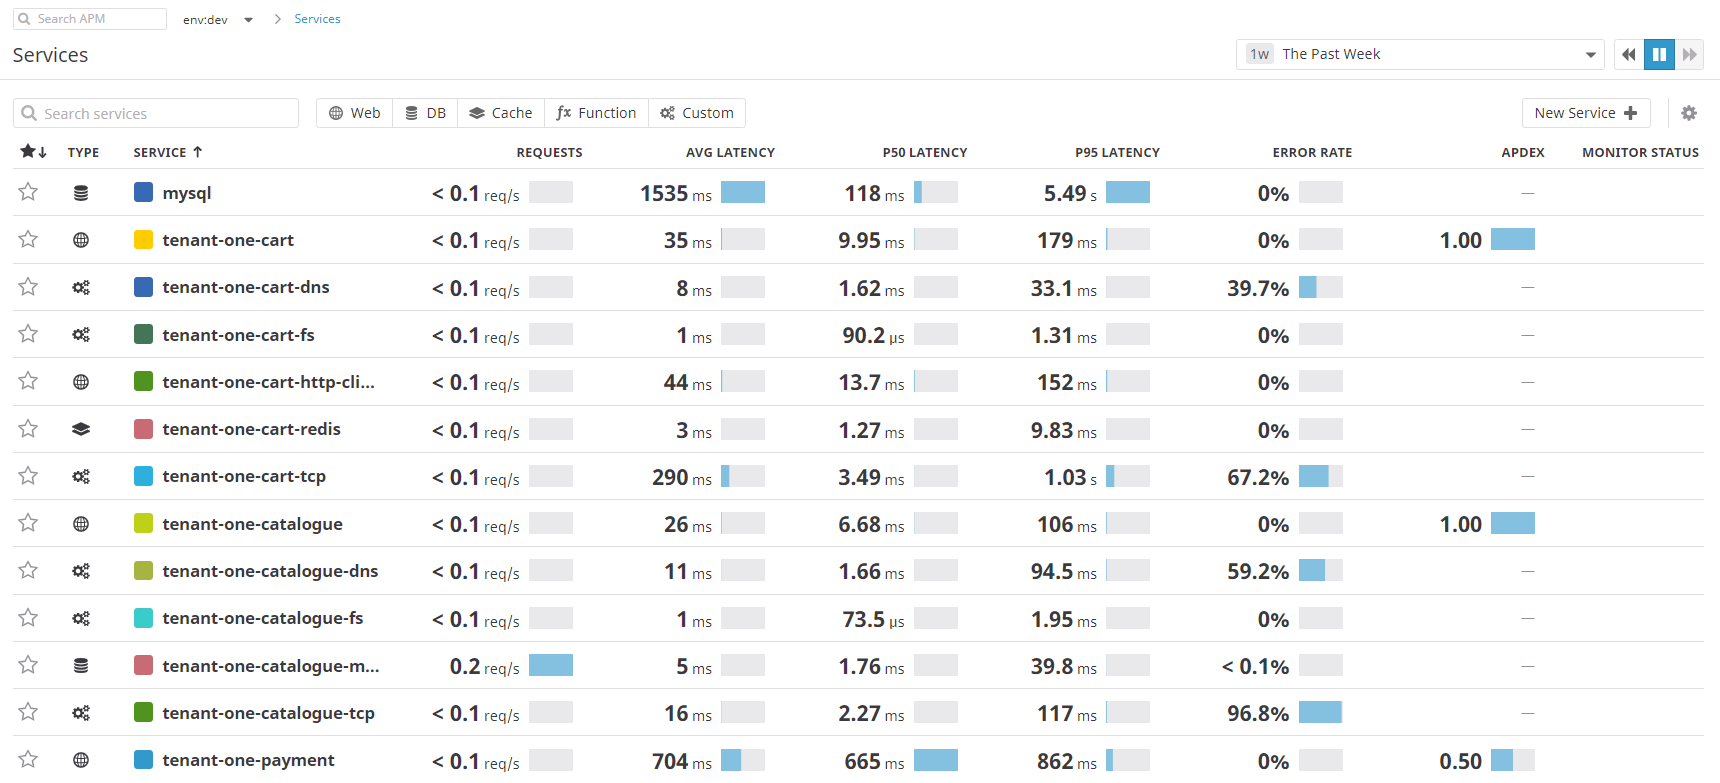
Datadog Application Performance Monitoring (APM or tracing) provides you with deep insight into your application’s performance—from automatically generated dashboards for monitoring key metrics, like request volume and latency, to detailed traces of individual requests—side by side with your logs and infrastructure monitoring. When a request is made to an application, Datadog can see the traces across a distributed system, and show you systematic data about precisely what is happening to this request.
Spans
A span represents a logical unit of work in a distributed system for a given time period. Multiple spans construct a trace. Datadog APM allows you to customize your traces with span tags to include any additional information you might need to maintain observability into your application. Instructions on how to set span tags based on programming language: https://docs.datadoghq.com/tracing/guide/add_span_md_and_graph_it/?tab=java#instrument-your-code-with-custom-span-tags
After adding span tags to the application code, they can be analyzed in Datadog’s APM Traces page: https://docs.datadoghq.com/tracing/guide/add_span_md_and_graph_it/?tab=java#leverage-your-custom-span-tags-with-app-analytics
Infrastructure

-
All machines show up in the infrastructure list.
-
You can see the tags applied to each machine. Tagging allows you to indicate which machines have a particular purpose.
-
Datadog attempts to automatically categorize your servers. If a new machine is tagged, you can immediately see the stats for that machine based on what was previously set up for that tag.
Host Map
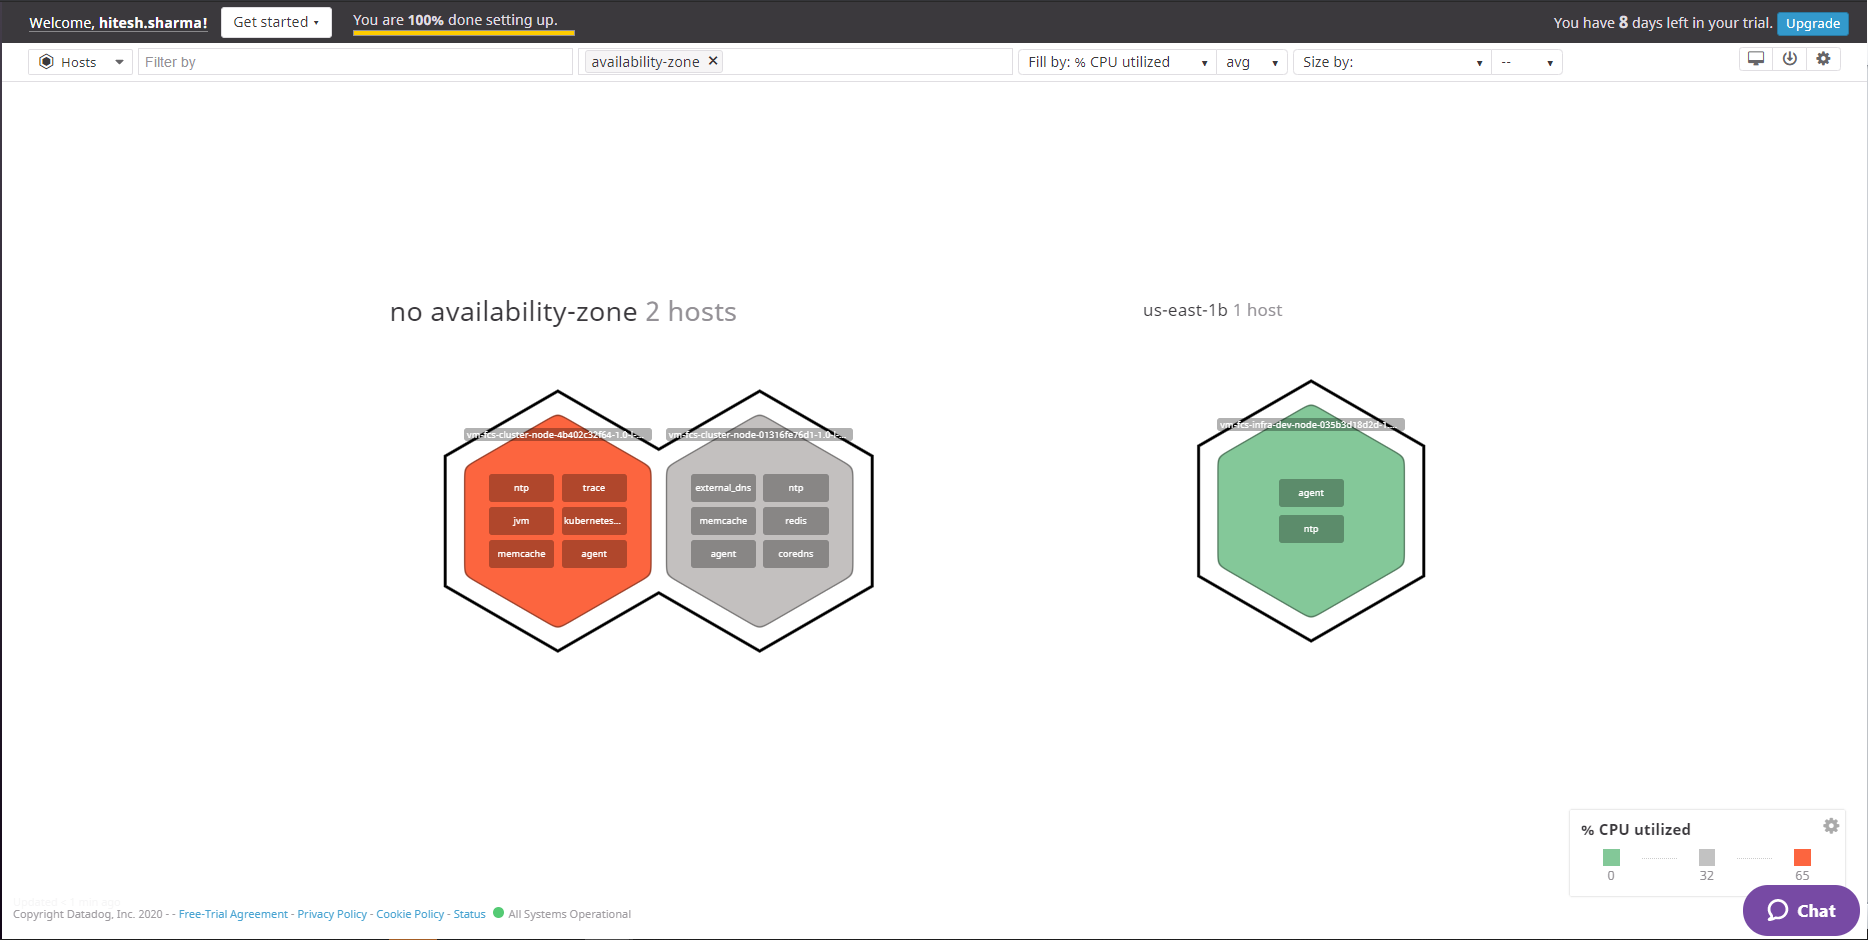
The Host Map can be found under the Infrastructure menu. It offers the ability to:
-
Quickly visualize your environment
-
Identify outliers
-
Detect usage patterns
-
Optimize resources
Events
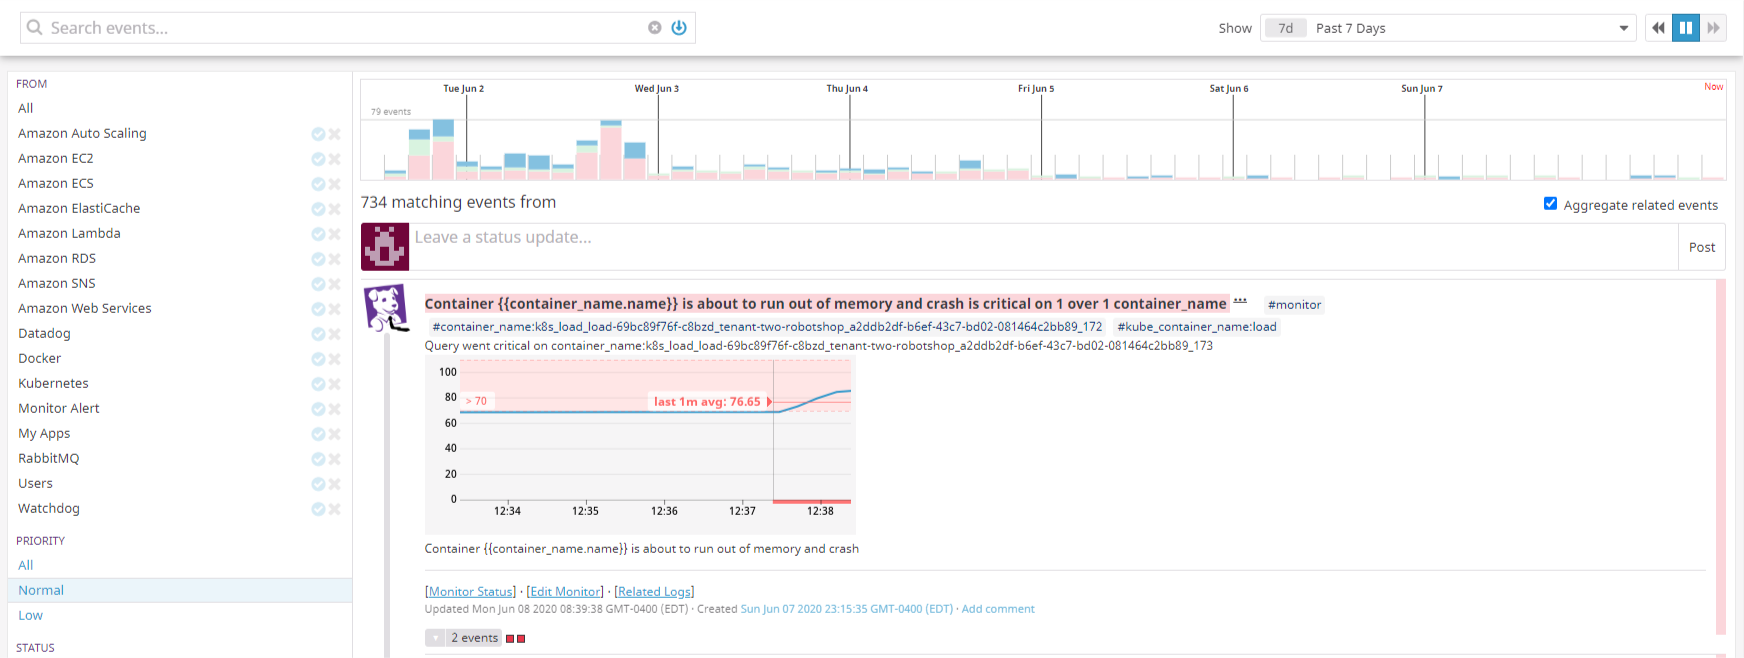
The Event Stream is based on the same conventions as a blog:
-
Any event in the stream can be commented on.
-
Can be used for distributed teams and maintaining the focus of an investigation.
-
You can filter by
user,source,tag,host,status,priority, andincident.
For each incident, users can:
-
Increase/decrease priority
-
Comment
-
See similar incidents
-
@ notify team members, who receive an email
-
@support-datadogto ask for assistance
Dashboards
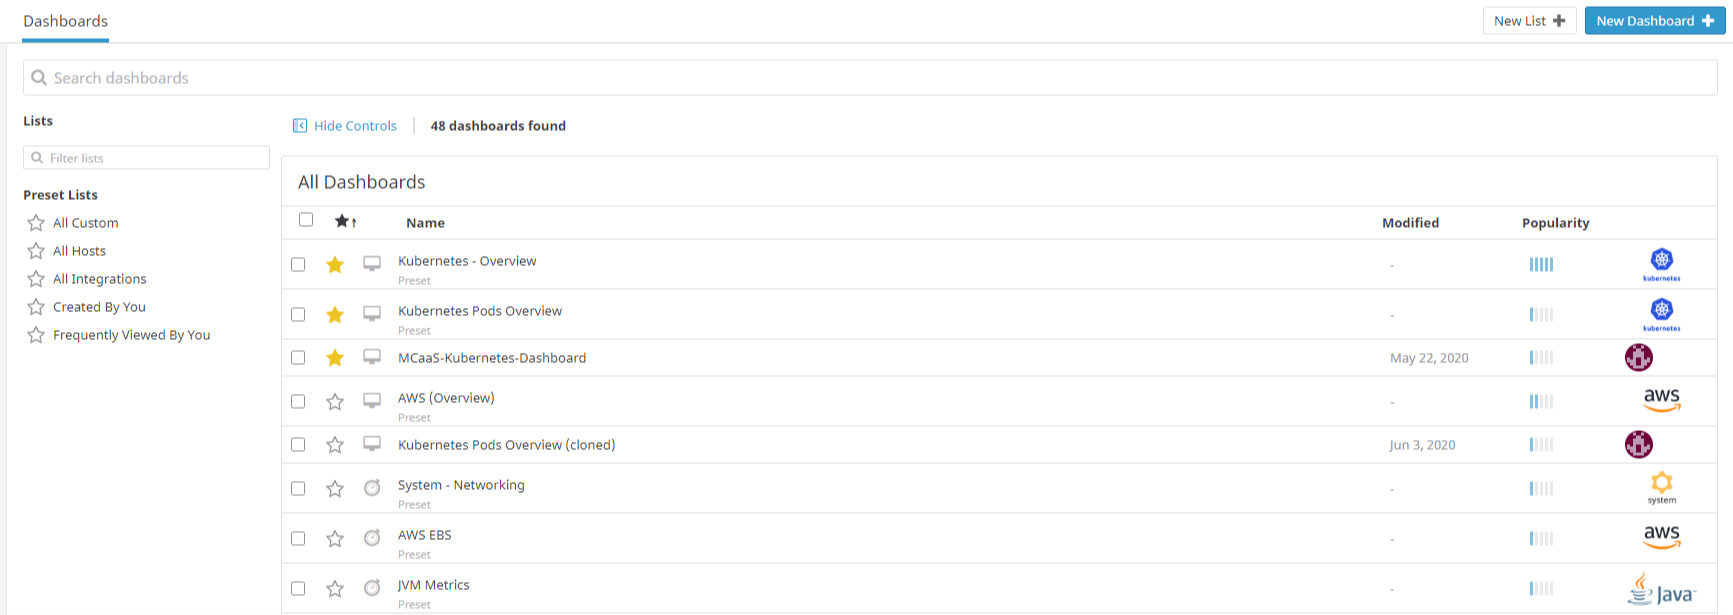
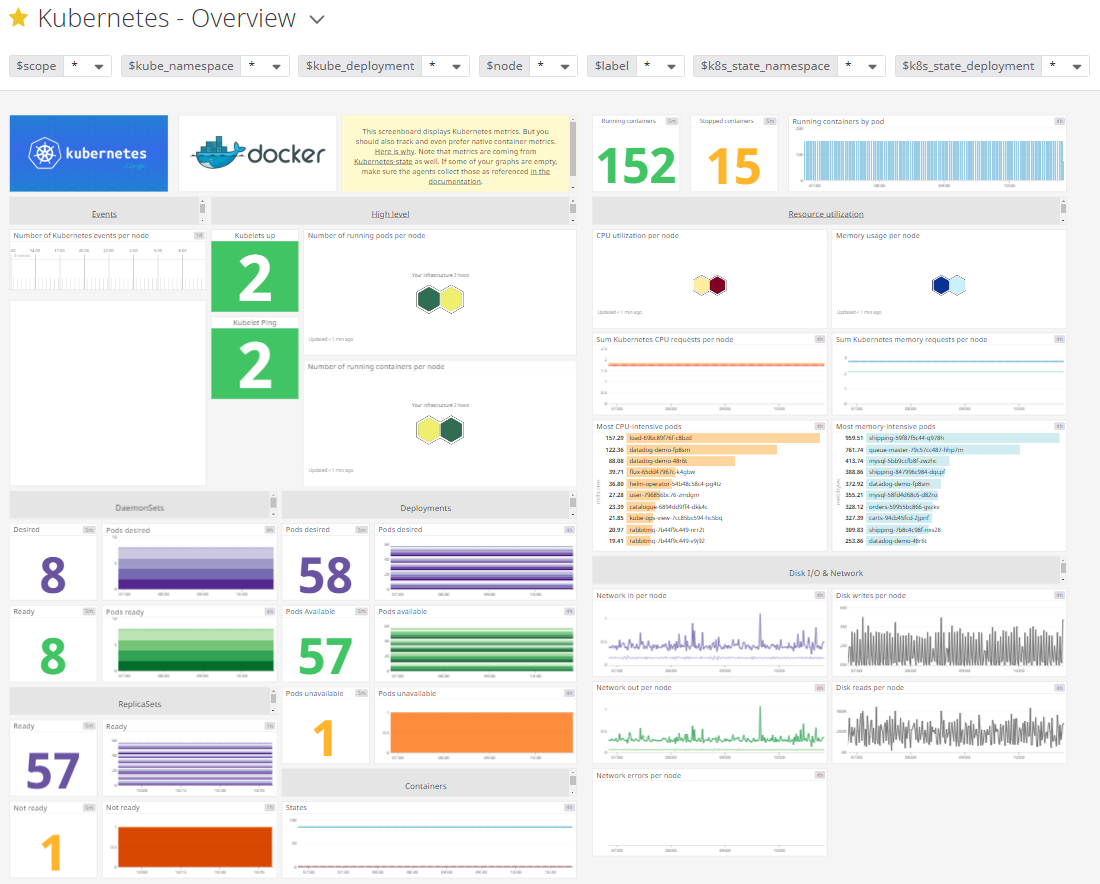
Dashboards contain graphs with real-time performance metrics.
-
Synchronous mousing across all graphs in a screenboard.
-
Vertical bars are events. They put a metric into context.
-
Click and drag on a graph to zoom in on a particular timeframe.
-
As you hover over the graph, the event stream moves with you.
-
Display by zone, host, or total usage.
-
Datadog exposes a JSON editor for the graph, allowing for arithmetic and functions to be applied to metrics.
-
Share a graph snapshot that appears in the stream.
-
Graphs can be embedded in an iframe. This enables you to give a 3rd party access to a live graph without also giving access to your data or any other information.
Monitors
Monitors provide alerts and notifications based on metric thresholds, integration availability, network endpoints, and more.
-
Use any metric reporting to Datadog
-
Set up multi-alerts (by device, host, etc.)
-
Use
@in alert messages to direct notifications to the right people -
Schedule downtimes to suppress notifications for system shutdowns, off-line maintenance, etc.

Network Performance Monitoring
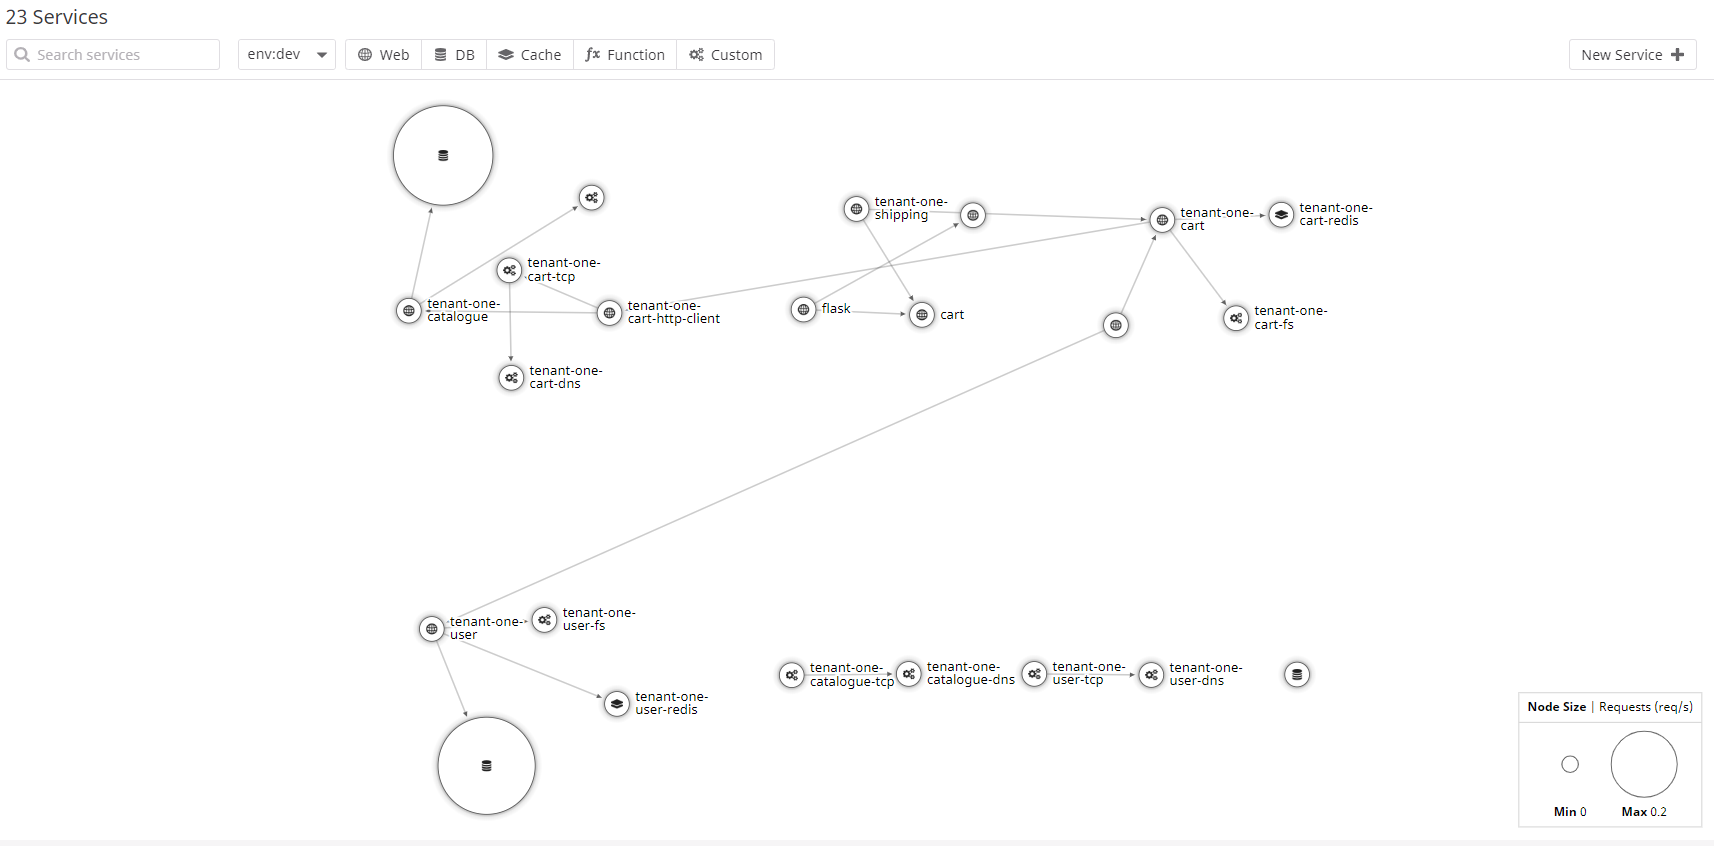
Datadog Network Performance Monitoring (NPM) gives you visibility into your network traffic across any tagged object in Datadog: from containers to hosts, services, and availability zones. Group by anything—from datacenters to teams to individual containers. Use tags to filter traffic by source and destination. The filters then aggregate into flows, each showing traffic between one source and one destination, through a customizable network page and network map. Each flow contains network metrics such as throughput, bandwidth, retransmit count, and source/destination information down to the IP, port, and PID levels. It then reports key metrics such as traffic volume and TCP retransmits.
Real User Monitoring
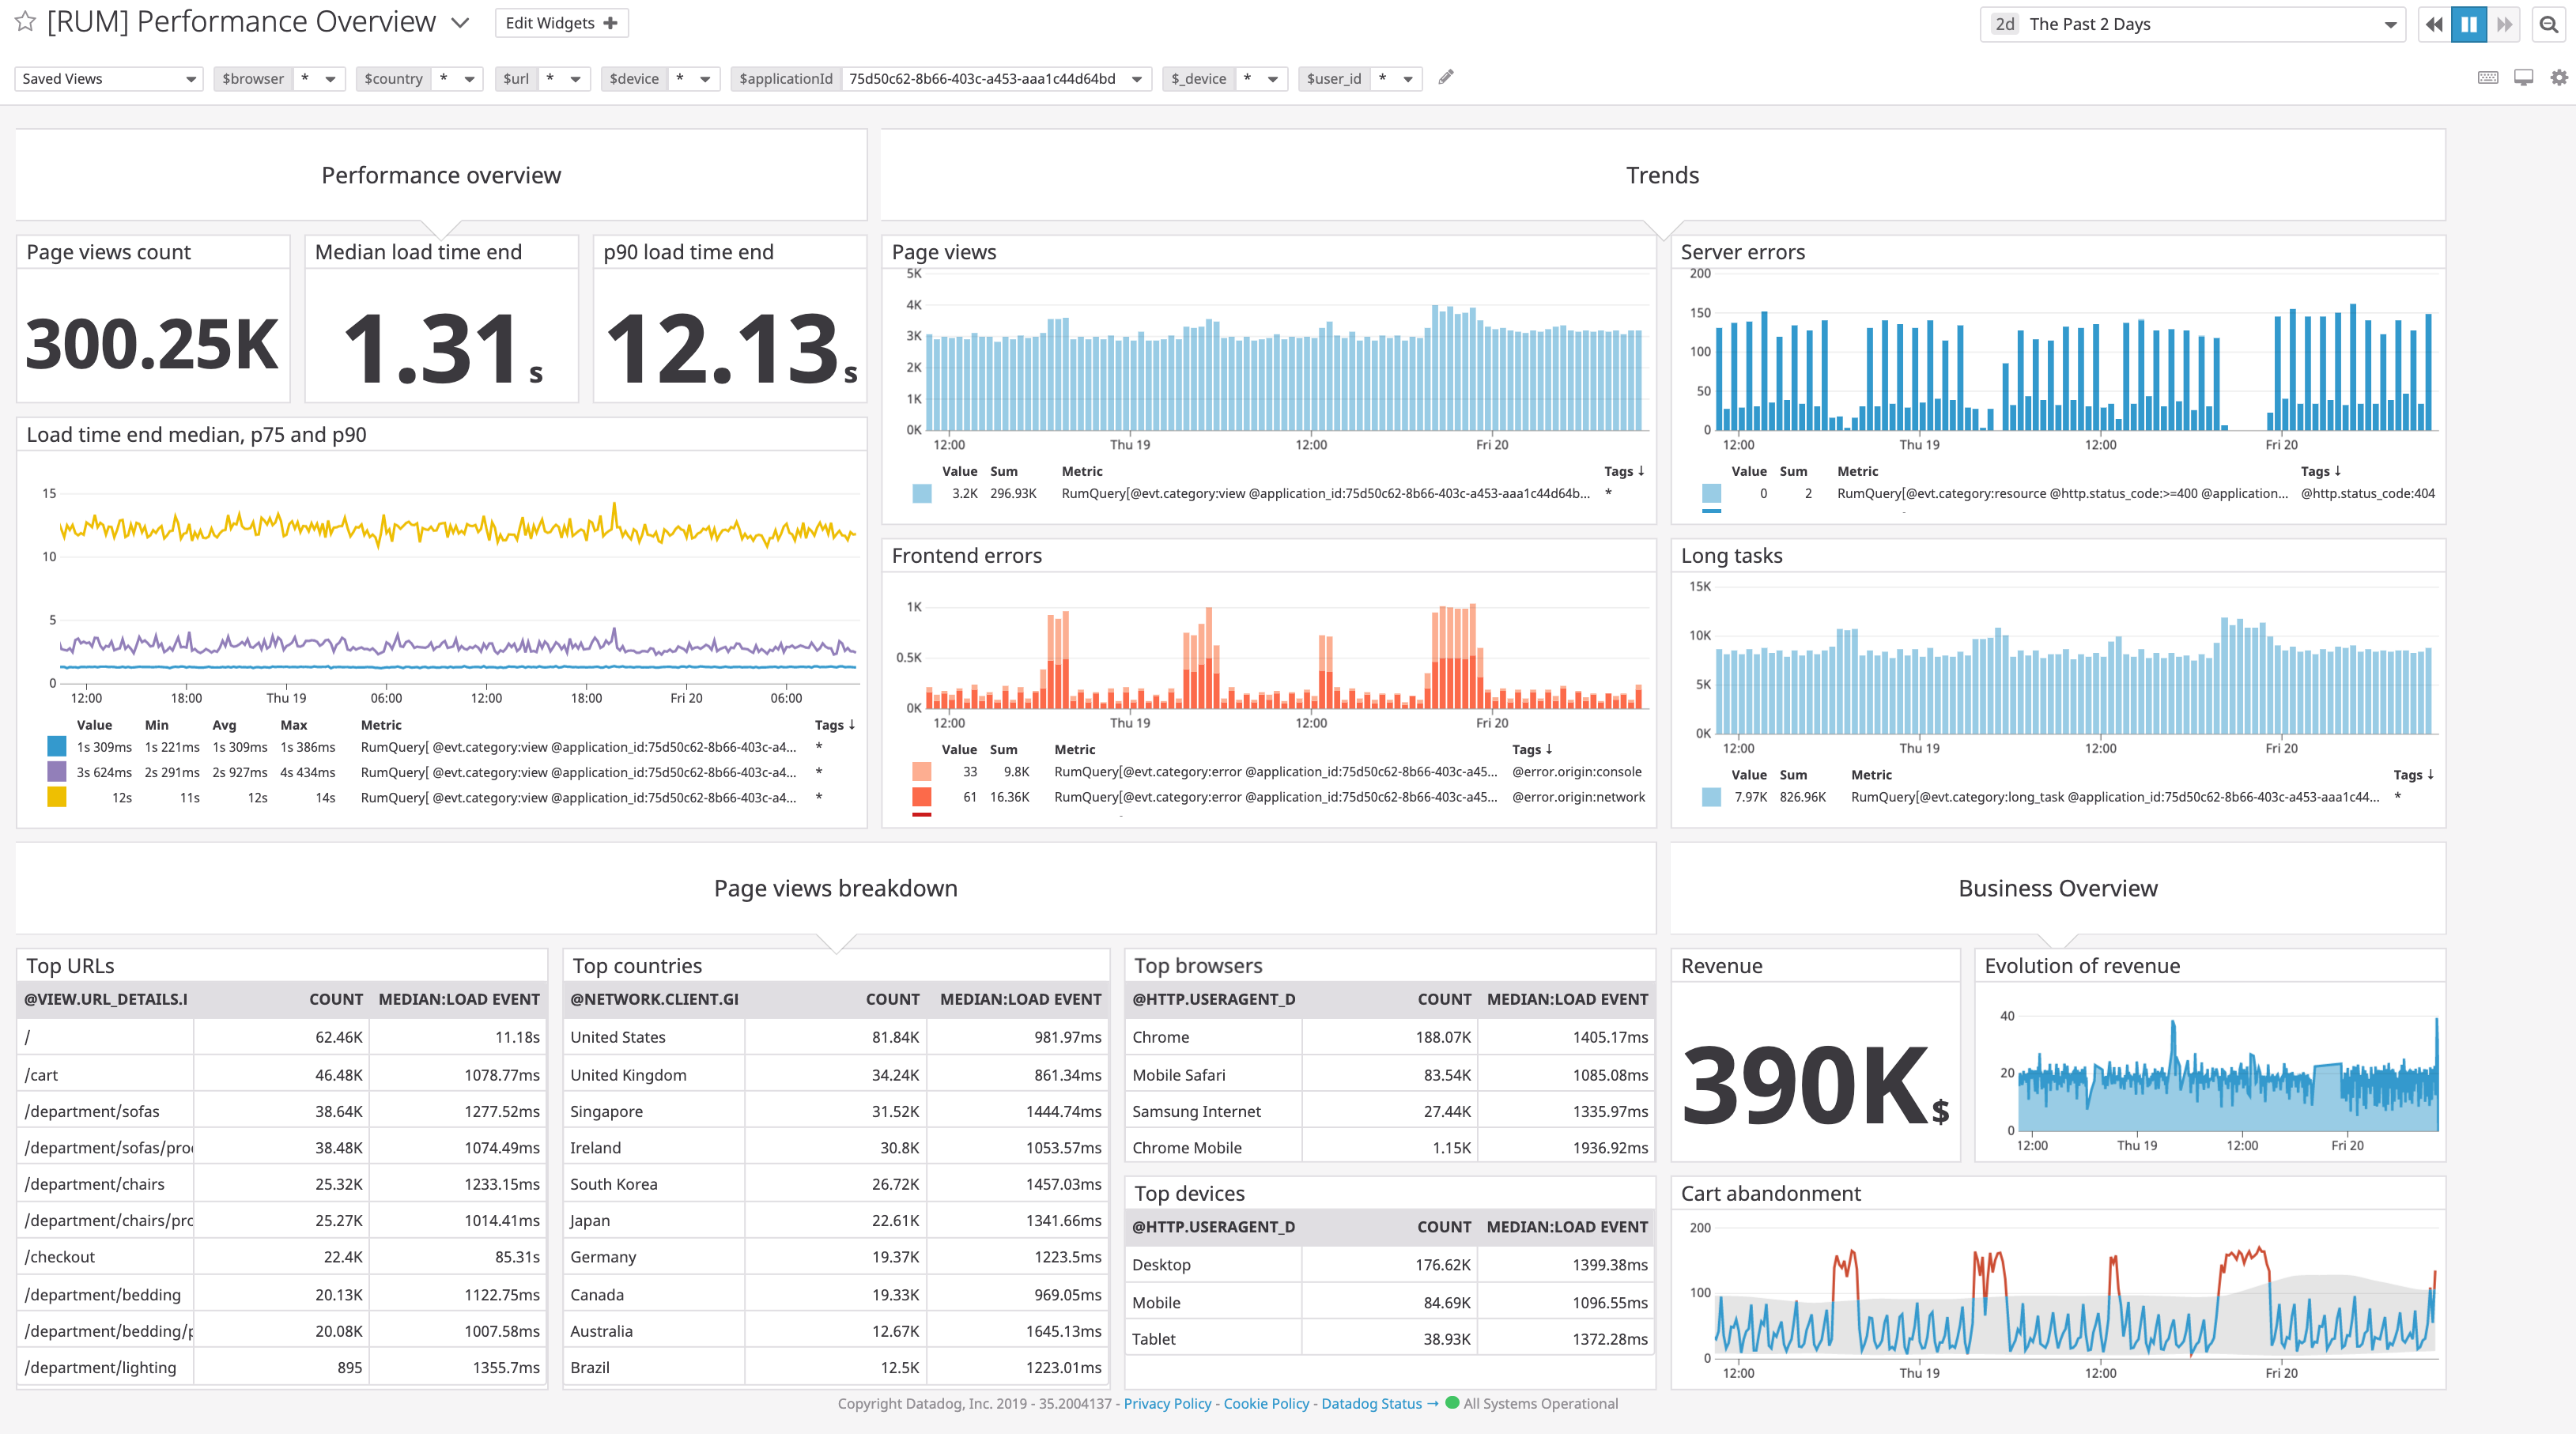
Datadog Real User Monitoring (RUM) enables you to visualize and analyze the real-time activities and experiences of individual users to prioritize engineering work on the features with the highest business impact. You can visualize load times, frontend errors, and page dependencies, and then correlate business and application metrics so that you can troubleshoot quickly with application, infrastructure, and business metrics in a single dashboard.
