About MCaaS
Logging Without Limits
This guide identifies key components of Logging Without Limits such as Exclusion Filters, and Monitors that can help better organize Log Explorer and monitor our KPIs over time.
Key Features
To identify the most logged service status we need to follow the steps below
- In Log Explorer, select the graph view located next to the search bar.
- Below the search bar, set count * group by service and limit upto top 10.
- Select Top List from the dropdown menu next to hide controls.
- Click on the first listed service (that's our most logged service) and select search for in the populated menu. This generates a search, which is visible in the search bar above, based on our service facet.
- Switch group by service to group by status. This generates a top statuses list for our service.
- Click on the first listed status and select search for in the populated menu. This adds our status facet to the search.
To create a log pattern for exclusion filter
- Click on a pattern from the pattern view list.
- Click the Add Exclusion Filter button in the top right corner. This button is disabled if less than half of the logs in this pattern fall into a single index.
- The log index configuration page opens in a new tab with a pre-filled exclusion filter for the index (in our case index is main) where the majority of the logs for that pattern show up.
- The exclusion filter is populated with an automatically generated search query associated with the pattern. Input the filter name and set an exclusion percentage and then save the new exclusion filter.
Note: Excluded logs are discarded from indexes, but still flow through the Livetail and can be used to generate metrics and archived.
Steps to check the logs on live trails:
- Click on Logs and select live trails.
- In the search bar add the query. (for example if we want to search on the basis of service name & status type)
- Query = service:rancher status:info.
- All the logs excluded by exclusion filter will be available here.
Create Anomaly Monitor
- Click on Monitors -> New Monitor -> Anomaly.
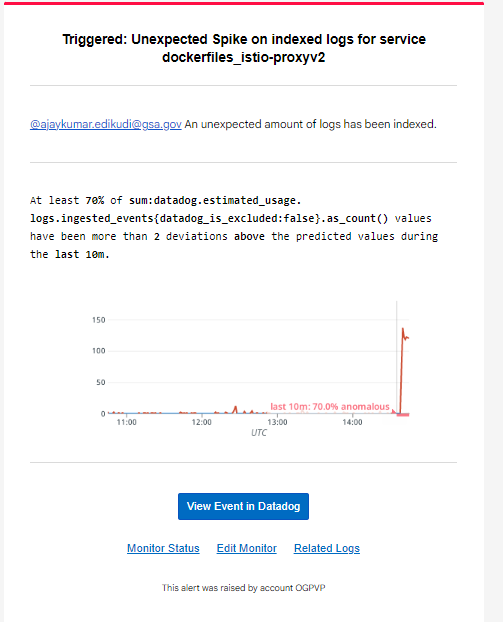
- Any metrics currently reporting to Datadog is available for monitors. For our use-case we can use datadog.estimated_usage.logs.ingested_events to detect any unexpected spikes on indexed logs on particular service.
- Add datadog_is_excluded:false in the from section (to monitor indexed logs and not ingested ones)
- Add the tag service and datadog_index in count by (to be notified if a specific service spikes or stops sending logs in any indexes)
- Set the alert condition to match the use case. (for example, an evaluation window, or number of times outside the expected range)
- We can set notifications with detailed message and notify our team.

test
